An Important Change in Volume While the Other Indicators Do Nothing
A low-volume rally isn't necessarily bearish.
You've reached your free article limit
You've read 0 of 1 free Pro articles.
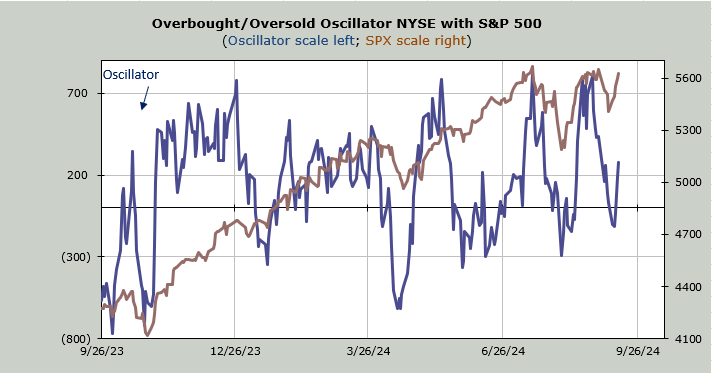
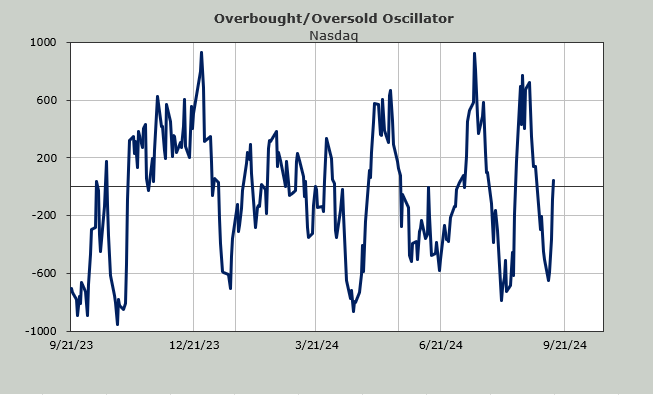
Friday’s action did very little to change the indicators. The only thing I can cite is that we’re inching closer to a short-term overbought condition. I expect us to be overbought mid to late this week.
I should also note that the Daily Sentiment Index (DSI) for the VIX did not budge; it remains at 19. A down day on Monday would halt the string of up days in the major indexes and likely turn the VIX’s DSI toward legal drinking age. We still have a higher low in the VIX so I’ll be watching to see if the DSI falls toward/under 15 as we get overbought.
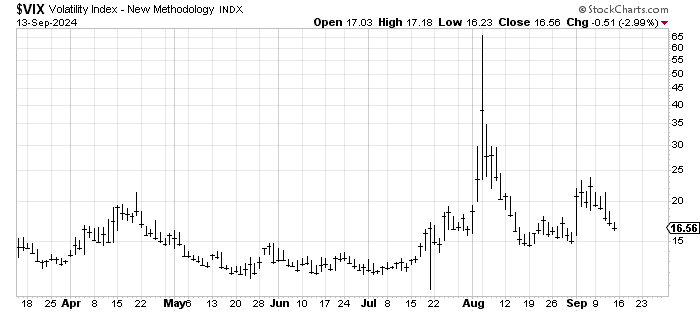
One final word on the DSI: the precious metals, gold and silver are both at 85 so they are entering the zone that screams do not chase up here.
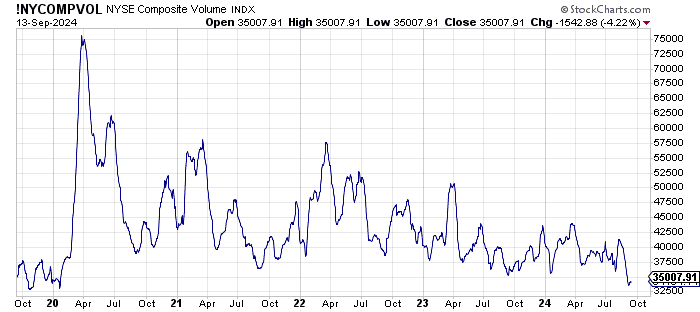
There is one indicator chart I do want to highlight. It is the 20-day moving average of NYSE volume. It has fallen to its lowest level since just before Covid in February 2020. Long-time readers will know that I do not view low-volume rallies as bearish. In fact I am a big fan of high volume declines (they are bullish). However, this is a change, taking volume out of the range it has been in for the last four and a half years.
I highlight this because if that VIX DSI gets lower and we do get a bout of volatility into the end of the quarter (likely), volume should rise as it tends to do with higher volatility.
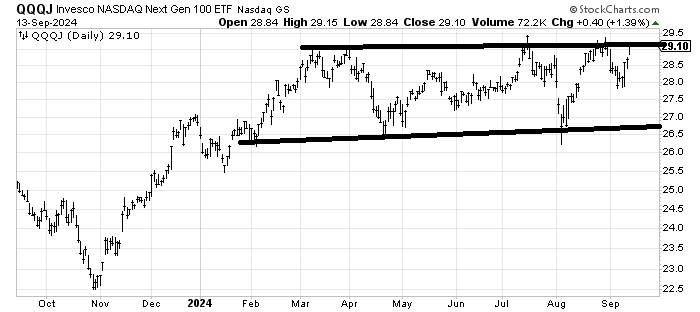
There are a few charts I want to highlight today. A few weeks ago, we looked at the QQQJ. It doesn’t trade much, but it is the QQQ Juniors. I’ll call it the small-cap QQQs. It has lagged the Mega cap stocks all year, having literally gone nowhere. In the last month or so, it has outperformed the QQQs. It continues to capture my attention, especially now that it is pushing back up against those highs (and the QQQs aren’t even over the late August highs.)
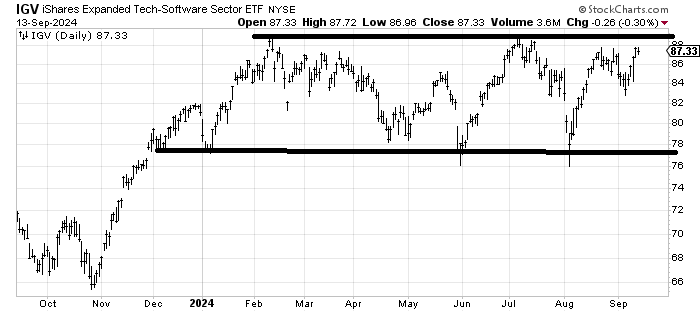
It looks awfully similar to the chart of IGV, an etf to be long software. Software hasn’t eaten the world in a long time, so it is something to pay attention to.
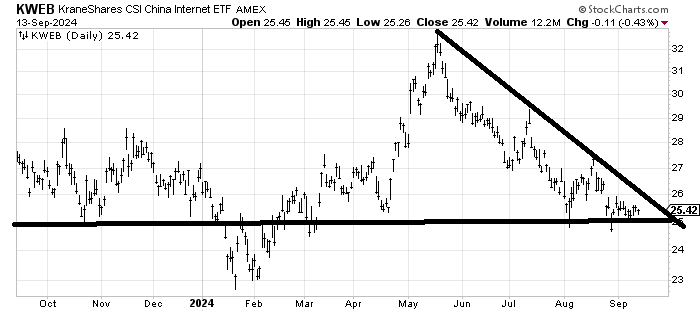
As a bottom fisher, I am drawn to down and out charts, so I can’t help that I keep staring at the chart of KWEB, an etf to be long Chinese Internet stocks. In the last few weeks, the ETF has barely budged. It didn’t go down with us in early September nor did it rally last week. Is it sold out? Is there so little interest in it that no one even cares about it anymore? The range has become so tight that whichever way it breaks, it will be important. Over 26, and it will break a downtrend that has been in place since May. Under 25, and I am wrong to think this is a decent place to bottom fish.