Amid All the Selling, Don't Ignore This One Bit of Good News
Based on the readings, it was only a matter of time before we got a day like Wednesday. Let's examine the aftermath, including something positive about the QQQs.
You've reached your free article limit
You've read 0 of 1 free Pro articles.
The Market
It looks like the overbought reading decided the final day of the month was the day. The most interesting thing is that the statistics, as bad as they felt, were not terribly extreme.
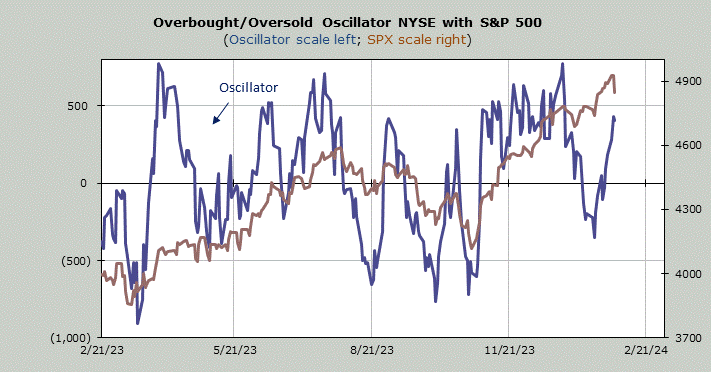
Let’s start with the Oscillator. That is not a mistake: it did not go down. That is the math. But you can see that not only is it overbought, it is also at a lower high.
While the new highs have been pathetic of late, we have not discussed the new lows because they have been steady. They remained steady on Wednesday. That means nothing much has changed in the Hi-Lo Indicator or in the data.
The McClellan Summation Index had no trouble ticking back down. It needs a net differential of +1,000 advancers minus decliners to halt the decline. Thus there is very little change in that indicator.
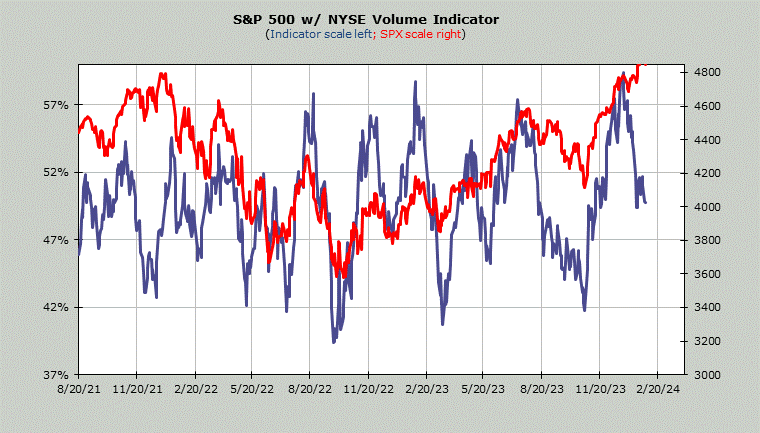
Down below you will see the Volume Indicator which is at 50%. This gets oversold at 47% in bull markets and around 42% in bear markets. So this is the only intermediate-term indicator that is even a little close to oversold.
The VIX was up, but it didn’t even get as high as it was two weeks ago or even earlier this week. But the VIX has been making higher lows since mid-December.
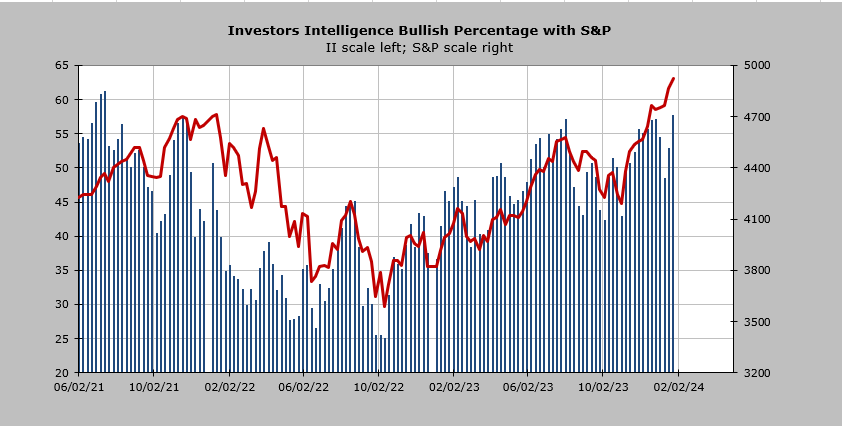
Sentiment wise I see a lot of anecdotal complacency, even after the day’s action. The Investors Intelligence bulls had ticked up this week to 57.7% and the bears ticked down to 16.9%. Needless to say they scream complacency.
But the put/call ratio did not surge nor did the ISEE call/put ratio fall. I suppose we’ll get to see some of the reaction in tomorrow’s AAII reading.
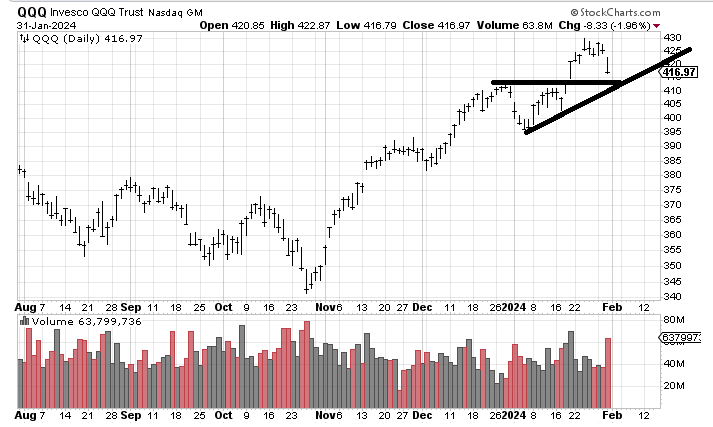
I will leave you with one bit of good news: the volume in the QQQs jumped to 63 million shares. High-volume declines in the Invesco QQQ Trust QQQ typically turn out bullish because it means there has been panic selling. That support line I drew in yesterday is shown on the chart.
New Ideas
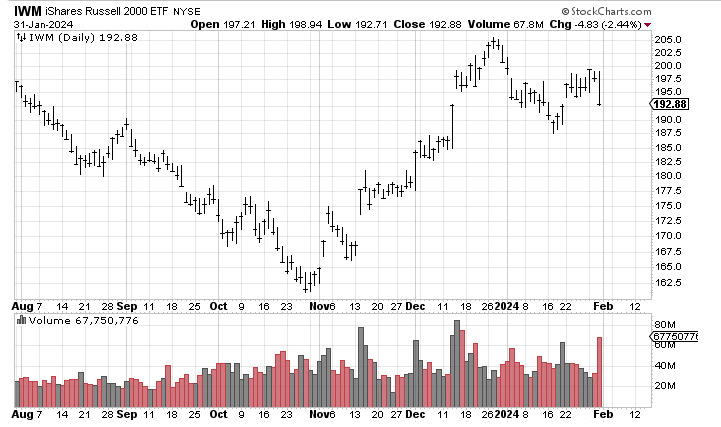
I have never determined if a high-volume decline in the iShares Russell 2000 ETF IWM is bullish, as it tends to be with the QQQs, because we tend to get light volume declines there. But Wednesday saw the highest volume in IWM since the December Fed meeting. And the gap on the chart fills just below here. I would not be surprised to see a short-term pop after today’s decline but I don’t think the correction is over yet.
Today’s Indicator
The Volume Indicator is discussed above.
Q&A/Reader’s Feedback
Helene welcomes your questions about Top Stocks and her charting strategy and techniques. Please send an email directly to Helene with your questions. However, please remember that TheStreet.com Top Stocks is not intended to provide personalized investment advice. Email Helene above.
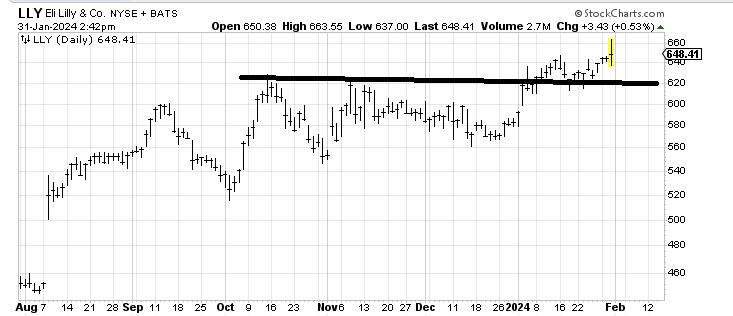
Eli Lilly LLY has a next measured target around $680 so as long as it stays over $620 I would expect it to work its way there.
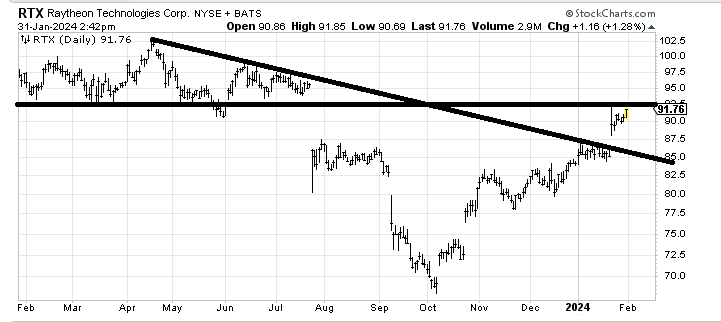
Raytheon Technologies RTX has resistance in this $92-93 area. Then there is a gap to fill around $95. There is also the 90/100 rule (90% of the stocks that make it to $90 will make it to $100). Unfortunately a stop is too far away for my taste: under $85. In the near term I expect some resistance all the way up. A move under $90 would be a short-term warning.
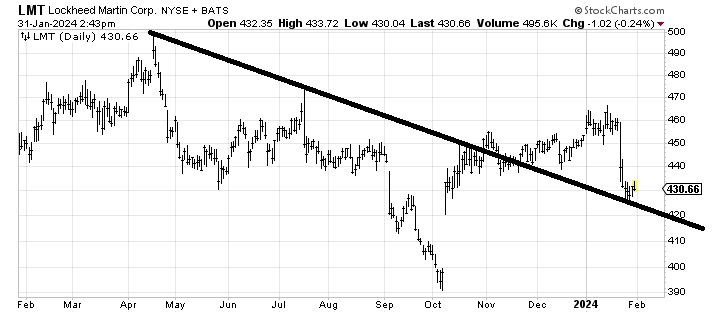
Lockheed Martin LMT has some support here but it needs more work in order to be able to lift itself over $440. In the near term I’d be a seller at $440-ish.
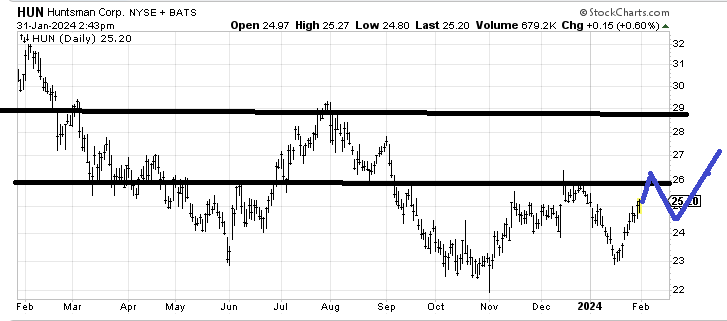
If Huntsman Corp. HUN can map out something akin to what I have drawn in then I think it can make its way toward $29-ish.
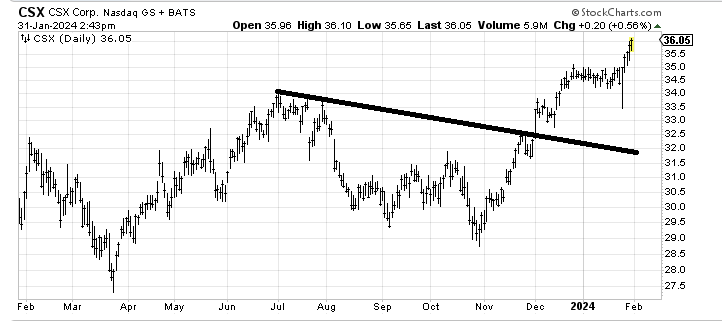
CSX Corp. CSX has a measured target in this $36-38 area so it is getting a bit over-extended and near its target. There is a longer-term target in the mid-$40s.