After Last Week's Action, Are Investors Panicky?
A review of the indicators will help us to understand how investors are feeling now.
You've reached your free article limit
You've read 0 of 1 free Pro articles.
I want to be able to tell you that since my timing was so bad last week (I thought we would rally again at the end of the week) it means we are now oversold. But I cannot do that.
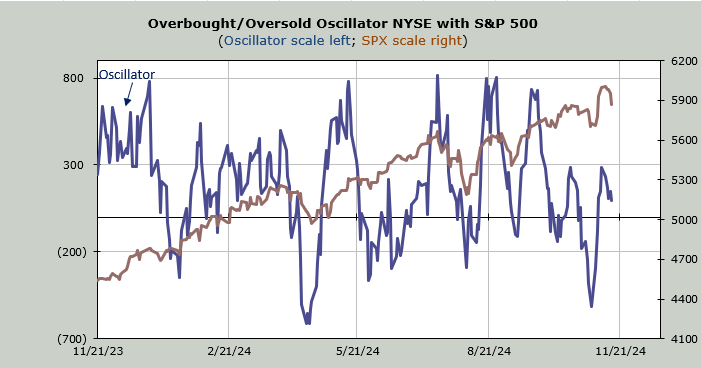
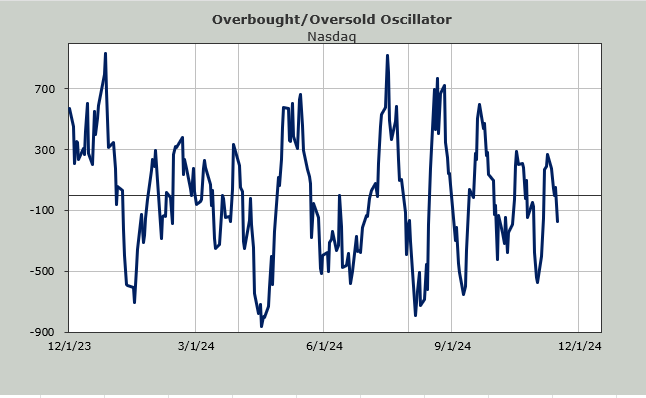
My Oscillator is based on the ten-day moving average of breadth. That means that we need to drop red numbers to be oversold. And the next six trading days bring us green numbers to drop.
That doesn’t mean we can’t rally it just means my Oscillator will likely be fighting it the entire time.
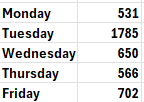
And, did you get the sense sentiment turned sour late last week? I would say a smidge. There was some chatter but the put/call ratio got to .90 on Friday. That’s a far cry from any sort of panic reading. Just prior to the election we saw 1.12 and 1.33.
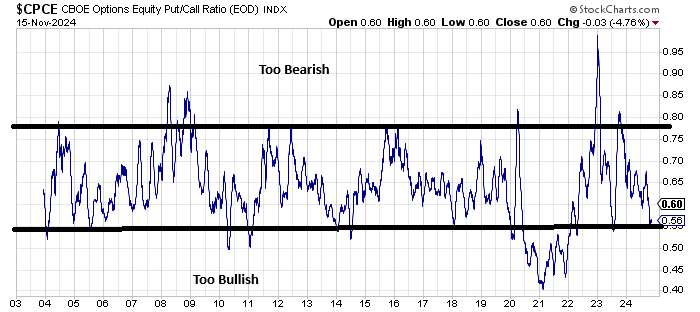
But let’s step back and look at the 30-day moving average of the equity put/call ratio. Once it gets under this .55 area it tells us folks are leaning too bullish. I would also use the term complacent. Perhaps it’s the time of the year. Perhaps we are about to repeat 2020-2021 when it slipped under it and stayed there for about two years. But in the last twenty years, that was the only instance where it went under and stayed there.
There are a few other indicators that have popped up that look like that early 2021 period as well. In the last few weeks, I have noted the meme stocks have come alive. But it’s more than that. In the last ten trading days, Nasdaq has popped and dropped. Oh, it hasn’t given up the entire rally, but it is now up only three percent instead of six percent as it was early last week. Yet net volume (up minus down) has only been negative twice and Friday was one of those days.
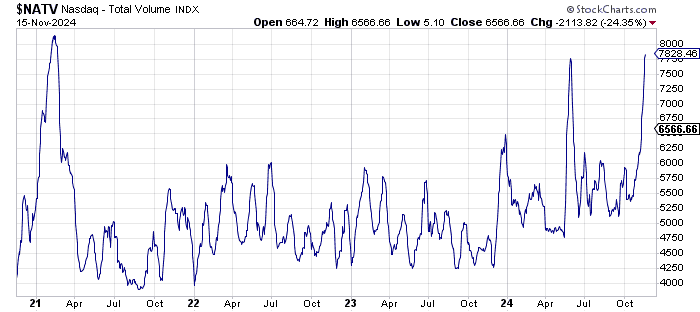
Also Nasdaq’s volume has been on the rise for a while now. The NYSE has not seen any commensurate rise in volume. The ten-day moving average of volume on Nasdaq is now at levels last seen in May and prior to that early January 2021. Maybe we’re in a new period where Nasdaq volume will regularly clock in at near 8 billion shares a day but this seems extreme to me.
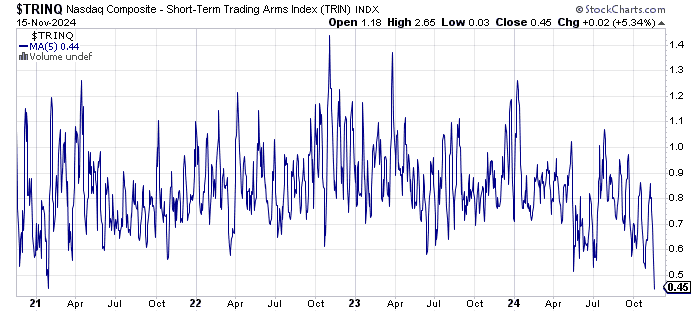
TRIN, or the Trading Index for Nasdaq is a measurement of advancing stocks and declining stocks relative to advancing volume and declining volume. When TRIN is high, it means folks are generally in a ‘sell everything’ mode (i.e. panic). When TRIN is low it generally means folks are feeling much more speculative. The last few days have seen Nasdaq’s TRIN quite low (not so for the NYSE), so I took a look at the five-day moving average. You can see it is now as low as it was in January 2021, the height of speculation in the meme and SPAC stocks.
Do I think last week’s action gave concern to many who had been bullish the week before? Yes. Do I think we saw panic? No. Only in some of the healthcare stocks.