A Pop and Drop Rally
A few strong days, but since then, weakness among most stocks.
You've reached your free article limit
You've read 0 of 1 free Pro articles.
We entered this week eying a market that was set up for an overbought condition. It has been my view that we’d reach that overbought condition by the end of this week.
My own Overbought/Oversold Oscillator is set to get to a maximum overbought (short-term) reading by Friday. It’s one reason I keep thinking we should have one more rally, yet so far the rally has been pathetic, attempting each day and giving it up. I have said I think the Oscillator ought to reach the top of the page and thus far it has refused to even exceed the October level. It gets another shot to do so on Thursday.
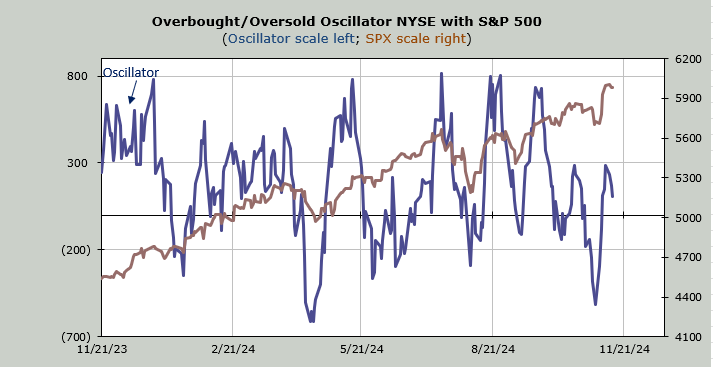
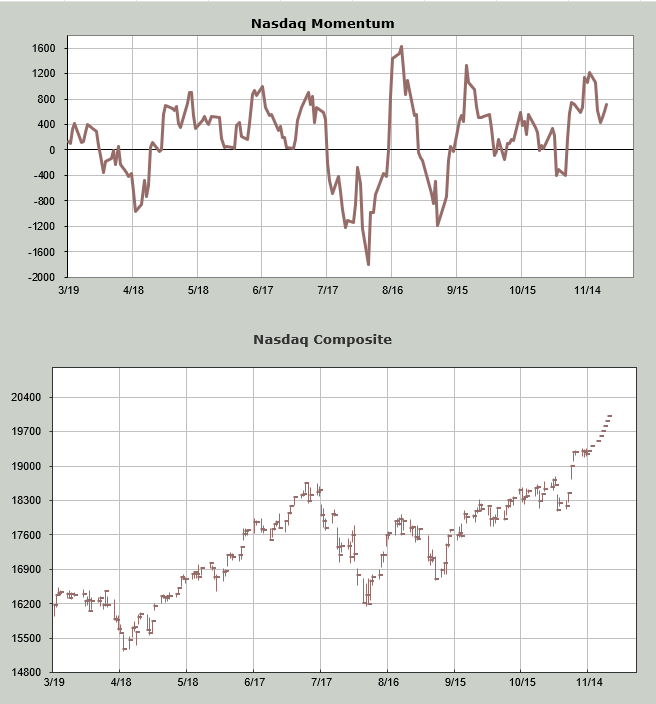
Earlier this week, we looked at the Russell 2000 Momentum Indicator and when I performed a ‘what if’ it showed we’d be overbought at the end of this week. Now I will show you the Nasdaq Momentum Indicator. Again, what I do here is plug in higher closes for Nasdaq over the next week or so to see the day/time period that price keeps rising and the indicator starts to fall since that is the definition of overbought. That occurs on Friday this week.
As a reminder, the exact day is not the point; it’s the general time frame (thus my call for end of the week, but we can couch it even more, the point is that we’re getting overbought).
I walked Nasdaq up to 20000 and the indicator falls anyway.
I have been harping about breadth not keeping up and that hasn’t changed, it’s still at a lower high. The McClellan Summation Index couldn’t even lift itself off the mat for the entire rally. This indicator, in my view, shows what the majority of stocks are doing, so in this case, they popped and dropped.
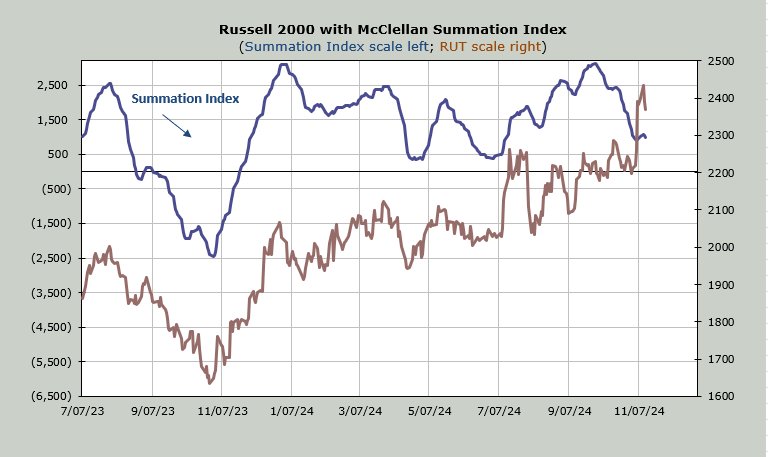
Not all stocks popped and dropped. Software has been great. The Banks popped, and so far, they pulled back, rallied again, but mostly, they have marked time. In fact, the Russell 2000 is now lower than where it closed last Wednesday, the day after the election. I repeat: this rally does not look like the prior elections to me.
The number of stocks making new highs peaked a week ago (Wednesday) and has not been able to surpass that reading again. I am less concerned with the new highs than I am with the fact that the new lows seem to expand almost daily, all while the indexes climb. We’ve looked at the raw data of new lows (now 168 for Nasdaq, the most since mid-October) but look at the ten-day moving average of new lows: it is now higher than it was in mid-October when the index was much lower. That’s what happens in down markets, not up markets. In up markets, the moving average should fall, not rise.
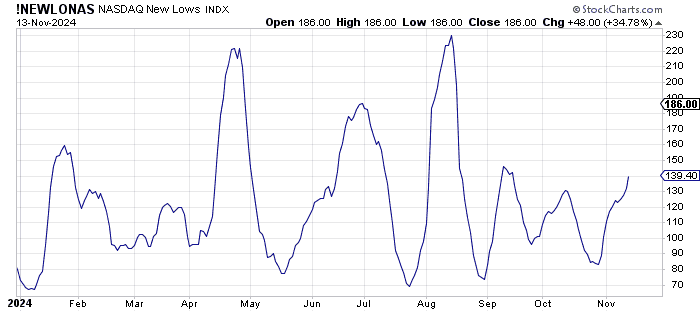
Anecdotally, everyone seems to think the rally lasts until year-end. Well, if this rally is going to last another six weeks, those new lows are going to have to contract, and new highs will have to expand.
The Investors Intelligence bulls did notch up over 60% this week but the bears are still a smidge over 20%. I suspect the AAII survey this week will not show extreme bullishness because the market has been so sloppy this week. But the put/call ratios remain on the low side.
