A Look Back at 2024 to See What Q4 Has in Store
There's been a shift in sentiment and market action throughout 2024. Let's recap the year-to-date to determine what's next.
You've reached your free article limit
You've read 0 of 1 free Pro articles.
As we head into the end of the quarter, let’s take a look at the year 2024 divided by quarters.
In the first quarter, the market was literally nothing but up. Every pullback was short and bought. The first week of the quarter was the worst for the S&P but after that, we had a few pullbacks that were percentage points down but they lasted days, not weeks.
Then, the second quarter opened with a sizeable pullback (about 5-6%), but then it, too, became a one-way street to the upside. The only pullback was in late May and it wasn’t deep but did last a few weeks.
Then came the third quarter. There is a big difference in the action in the third quarter, isn’t there? Unlike the first two quarters which began with pullbacks, the third quarter began with a rally. The S&P made it to 5650 and then had a roughly ten percent pullback.
Then there was another rally that didn’t make a higher high. That was followed by another pullback and so on. Now, we have a higher high, but overall the quarter has been quite different than the prior two. There has been no trend.
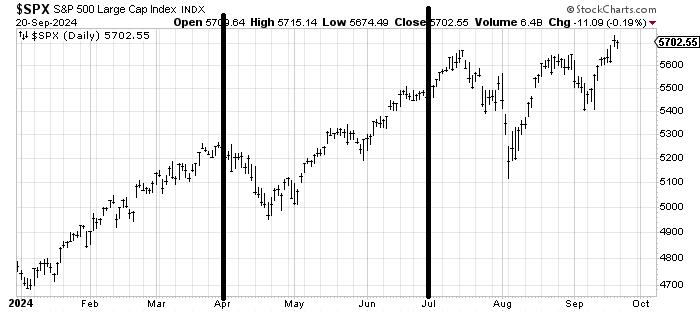
That means sentiment went from exuberant in July to much more of a back and forth bullish/bearish situation in the quarter. Another thing that happened in this third quarter is the market has responded to overbought and oversold conditions much more readily.
In the first half of the year, an overbought condition meant a two or three-day pullback, until we got to April. In the third quarter, it’s been much more responsive. And now, as we head into the end of the quarter, we find ourselves back to an overbought condition.
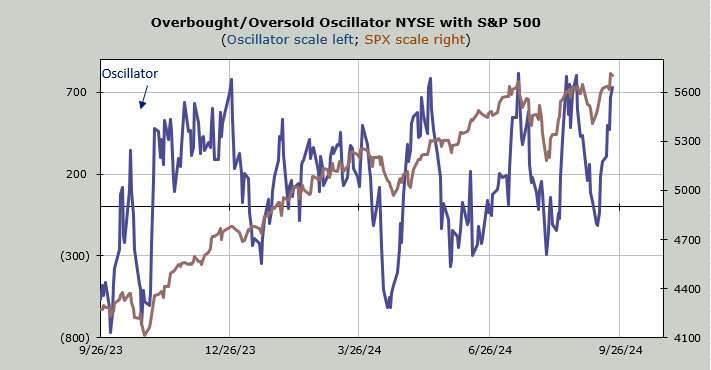
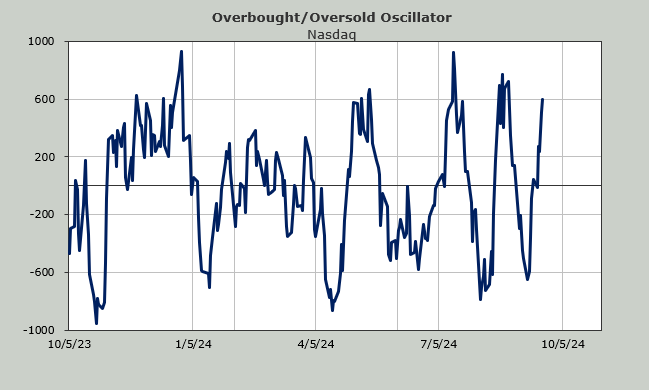
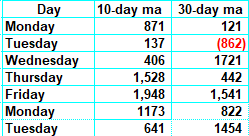
You can see the market is overbought on the chart, but now let’s take a look at the math behind it. I have noted for a week now that we would be overbought as we headed into the final week of the quarter. As a reminder, my Oscillator is based on the ten-day moving average of breadth so we look back at the numbers we are dropping from ten days ago. When there is a long string of red numbers to drop, we are oversold, and when there is a long string of positive numbers to drop we are overbought.
In the table below, I share with you the numbers we are dropping into the end of the quarter. In addition, I share the numbers we are dropping off the more intermediate-term 30-day moving average. As you can see there is not a lot of red on that table.
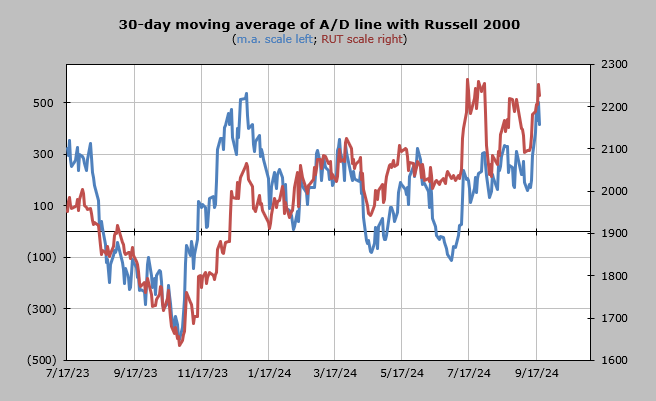
Here is the chart of the 30-day moving average of net breadth. It is now as overbought as it was in early January when the S&P had that quick two percent pullback and the Russell had a much more severe pullback.
The Daily Sentiment Index (DSI) for the VIX stood still on Friday at 16. With that reading so low and the market so overbought I maintain that we should see a bout of volatility as we head into the end of the quarter, a quarter that has been punctuated with more ups and downs than a rollercoaster and certainly more than the first half of the year.
