A Few Bulls Just Poked Their Horns Out
Let's check the International Securities Exchange's call/put ratio, the utilities, stock charts of Tesla and Northrop Grumman, and why this feels like short-covering.
You've reached your free article limit
You've read 0 of 1 free Pro articles.
The Market
I’m not quite sure today’s action convinced a whole lot of folks to turn bullish, but there were a few.
How can I tell?
The International Securities Exchange's call/put ratio slipped over 1.0 for the first time in 20-trading days (a month). It was a small gesture, but it was there.
Today did feel like an awful lot of short-covering, though. Just look at the action in a stock like Target TGT, which hasn’t had a bounce like that in months. Or our friend Roku ROKU, which tagged that $75 target and then that was it, it slid the remainder of the day.
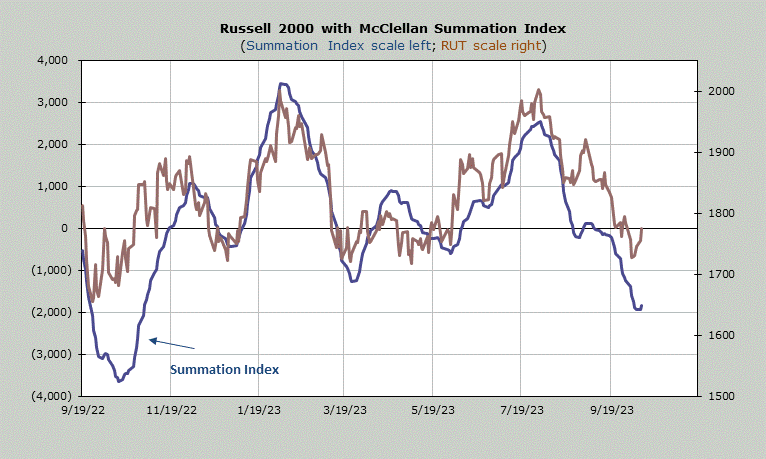
But breadth was the best it has been in more than a month and the McClellan Summation Index finally turned upward. It’s not easy to see, but it does appear to be a fishhook down there. The chart is below.
The utilities have now rallied 7% since we saw what I believe was capitulation down there and shockingly for the second day in a row the Utes outperformed the QQQ QQQ. That is another reason this felt like short-covering. Folks already feel they own enough of the QQQ-type stocks.
A few other points of interest are that the declining 50-day moving average lines are getting quite close on many stocks and indexes. Fifty trading days ago was late July/early August, which means as we drop higher numbers and replace them with lower numbers, the moving averages will continue to decline. A declining moving average can often be near term resistance.
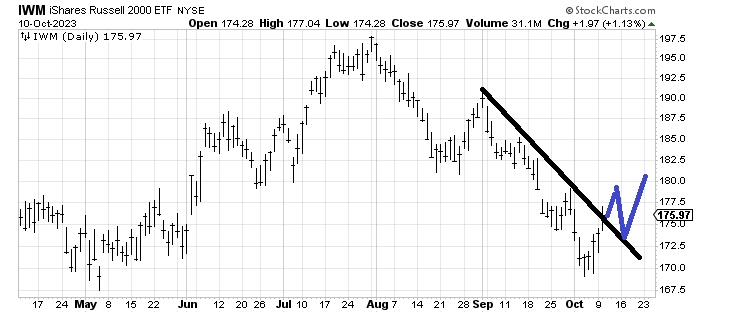
But let’s look at IWM, which was my index of choice to play for this rally. It is at some resistance as you can see. What I would love to see is what I’ve drawn in blue on the chart. Don’t fuss so much over the levels, but the pattern I drew in. I said yesterday I think we could see a pullback in the latter part of the week and if we do, I think we would then rally again next week.
The consumer price index and the producer price index are out the next two days, so we’ll get to see how the bonds (and stocks) react to them.
New Ideas
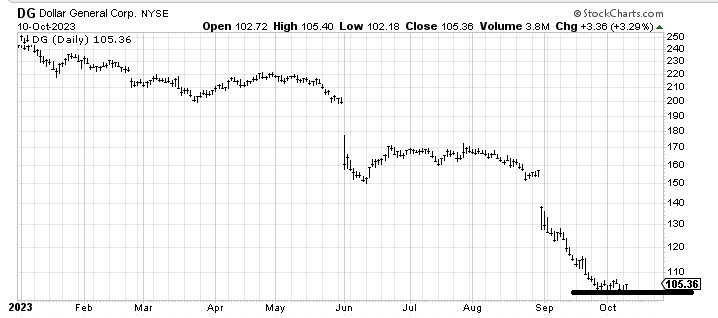
A couple of weeks ago I was asked about Dollar General DG, and I said I thought it was oversold enough to rally. It rallied and then came right back down. But I still think it has another rally in it. But I do not want to see it crack under $100.
Today’s Indicator
The McClellan Summation Index is discussed above.
Q&A/Reader’s Feedback
Helene welcomes your questions about Top Stocks and her charting strategy and techniques. Please send an email directly to Helene with your questions. However, please remember that TheStreet.com Top Stocks is not intended to provide personalized investment advice. Email Helene here.
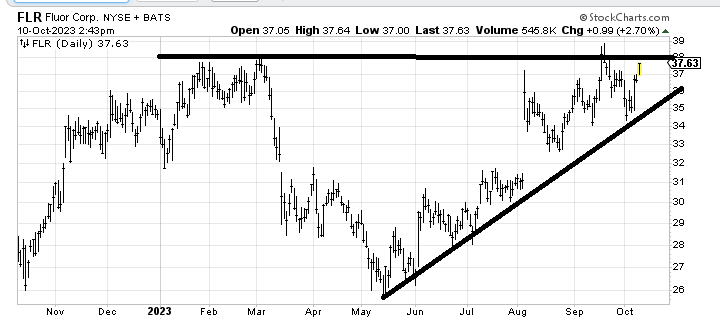
A Fluor Recipe: I recommended Fluor FLR last summer and the question is, What to do with it now? Since I think the market is in better shape now than it was then, I would hold. I would love to see it break out but I would be more concerned if it broke $34-$35. That uptrend line has been solid since May, so a break of it has got to be respected. I suspect that spike high at $39 will be trouble in the very near term.
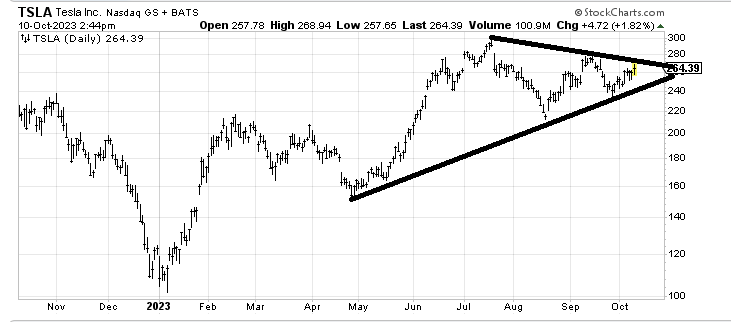
Tesla Triangle: I don’t know what to do with Tesla TSLA, because it is so far into the apex of that triangle that it has to breakout soon. Therefore if it breaks out to the upside I would respect it. If it backs off and breaks the recent low I suspect it holds that $230 area on the first trip down.
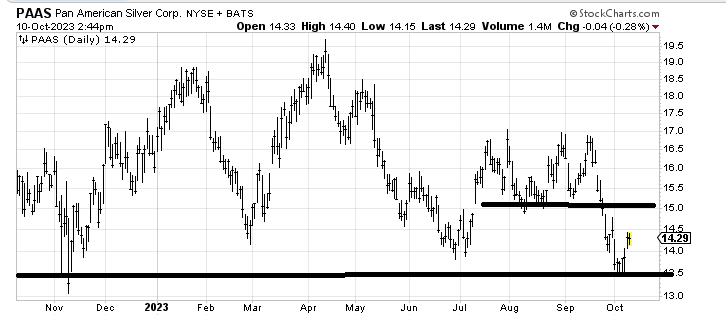
Silver Sale: Pan American Silver PAAS has been such a disappointment. For now I’d think a rally to $15-$16 runs into resistance and a break of $13.50 is a sale.
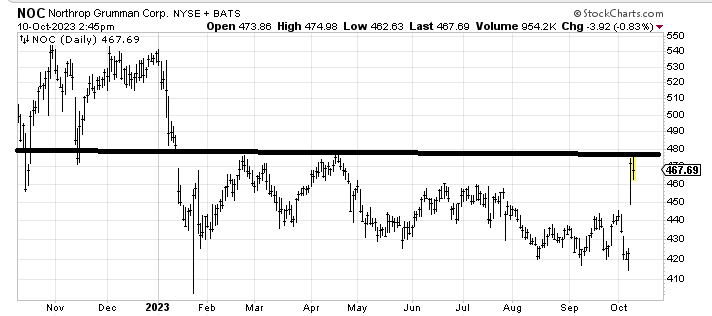
NOC on Wood: Northrop Grumman NOC is starting to look like a base is being built. Some sideways action between $450-$480 to digest the recent move and chew through some of that resistance seems likely before it attempts a push higher again.
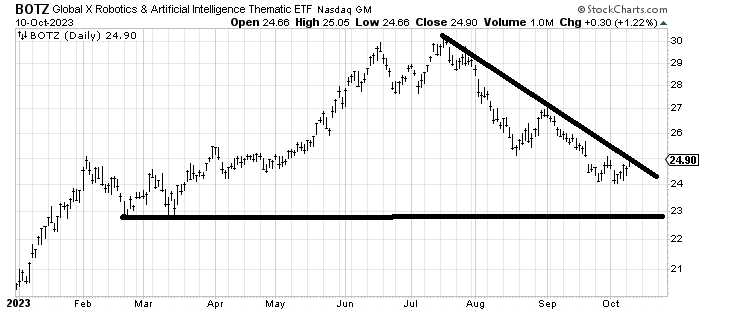
Wir sind die ... BOTZ: BOTZ BOTZ is an exchange-traded fund for robotics and artificial intelligence stocks and it looks like so many stocks with that downtrend line dating back to mid-July. If it can get over the line, then I think that changes the picture. So, it needs to clear $25 like it means it. It probably then pulls back to retest the line, but at least crossing the line would change the downtrend that has been in place for three months.