A Dull Market, but the Banks Are Starting to Look Interesting
They say that you should never short a dull market. So, if you can't short 'em, what should you buy? Well, the banks may be getting interesting.
You've reached your free article limit
You've read 0 of 1 free Pro articles.
For the last three trading days, Nasdaq has been hovering at the same level (around 18,000). Since Thursday, the Russell 2000 is down about 1.5%. Is that the overbought condition at work or something more?
I think it is the overbought condition. Some might say that if that’s the way we’re going to work the overbought condition off, then we should ‘never short a dull market’. Since I am not advocating shorting, I suppose I wouldn’t disagree.
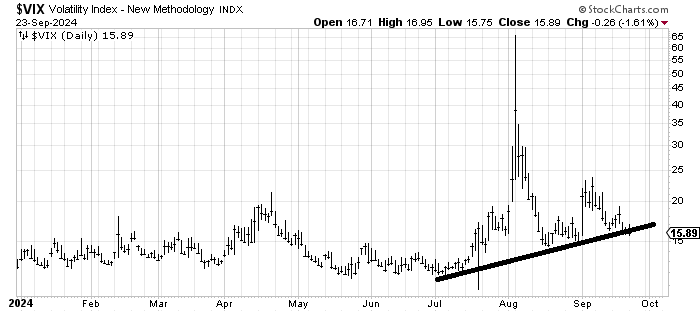
However, the VIX was red again on Monday, yet, once again, it did not make a lower low. It’s not so much that it has to hold that line; it's that it hasn’t even come close to the July low, thus a higher low. And, the Daily Sentiment Index (DSI) has been camped at 16 for three days now.
Maybe the VIX will go lower, but then the DSI will fall right into that lower teen range, or maybe even to single digits, and we know what happens when we get a single-digit reading in the DSI for the VIX. We get what we saw in August.
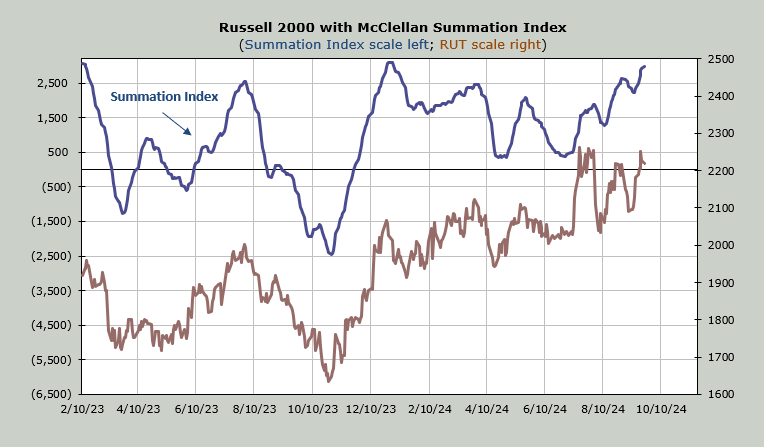
As for the other indicators, breadth remains steady and good. The McClellan Summation Index continues to rise. It needs a net differential of -800 advancers minus decliners on the NYSE to halt the rise. A week ago that number was -2100 so the cushion is shrinking a bit. To put -800 in context, breadth was negative -850 last Friday.
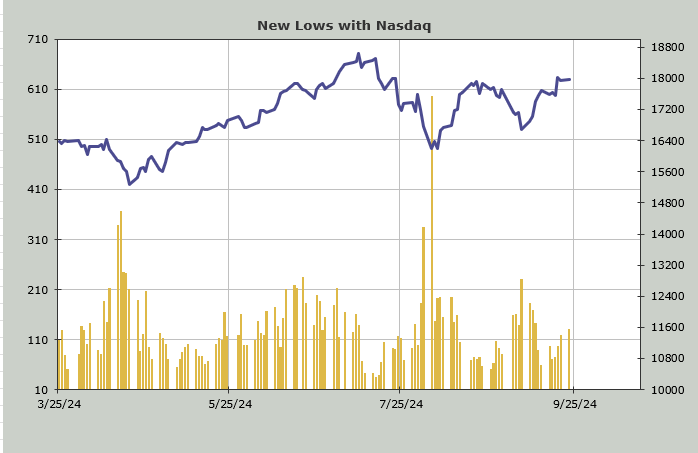
Yet there hasn’t been much selling despite the Russell losing 1.5%. The only indication there has been some selling is that the number of stocks making new lows on Nasdaq has climbed in the last few days to 130 (it was 71 a week ago). It is that time of the year (tax loss selling season), so we’ll monitor this to see if it gets out of control. Right now it’s inching up which makes me uncomfortable but not enough to fuss too much.
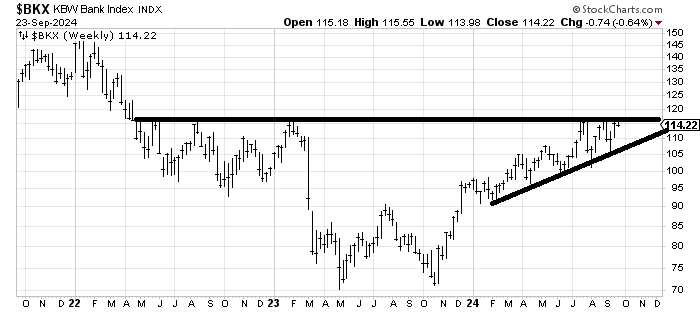
As long-time readers know, I turned bullish on banks just about a year ago (early November), but my target on the Bank Index was 115, and this summer I backed off the banks. As I stare at the long-term (three years, weekly) chart of the Bank Index (which was down on Monday) I find that 115 area looms large.
But we’ve also seen a series of higher lows all year (not many stock charts can say that). Once we get back to an oversold condition, it could be time to revisit the banks if this chart stays intact (i.e. higher lows).