A Day of Divergence
Let's check the action on Tuesday, and why a short-term oversold rally could set up soon. Also, we look at a bunch of charts, including Google and Bank of America.
You've reached your free article limit
You've read 0 of 1 free Pro articles.
The Market
We began the rally Monday morning with a concentration in the "Magnificent Seven" tech stars, but by the middle of the day it has spread out a bit more. There was no spreading out today.
Today was a big divergence. To wit: 68% of the volume on Nasdaq was on the downside.
Now, I would like to take a look at the Overbought/Oversold Oscillator I keep. It reached an overbought condition just as the calendar turned to 2024. That’s the blue line. Notice how it has stepped a toe under the zero-line for the first time, since it lifted above it in early November. It is now possible — especially if the market can get some downside in the next day or so — for us to have another short-term oversold rally set up for next week, perhaps even by Friday.
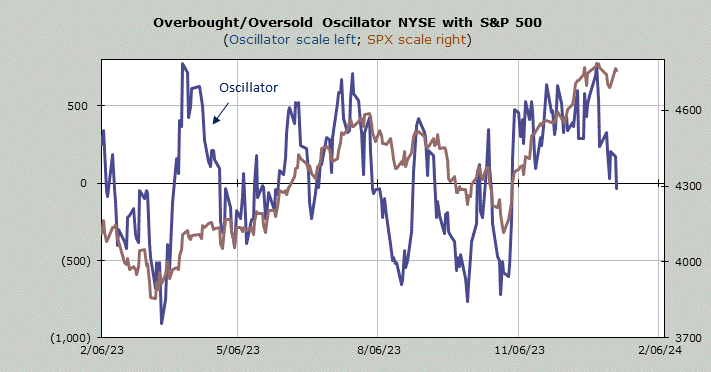
Yet on an intermediate-term basis, we are not close to oversold. So I would say the trend of most stocks has now turned down, but we can expect some oversold rallies as time goes on. The best markets for rallies are those that are short- and intermediate-term oversold at the same time.
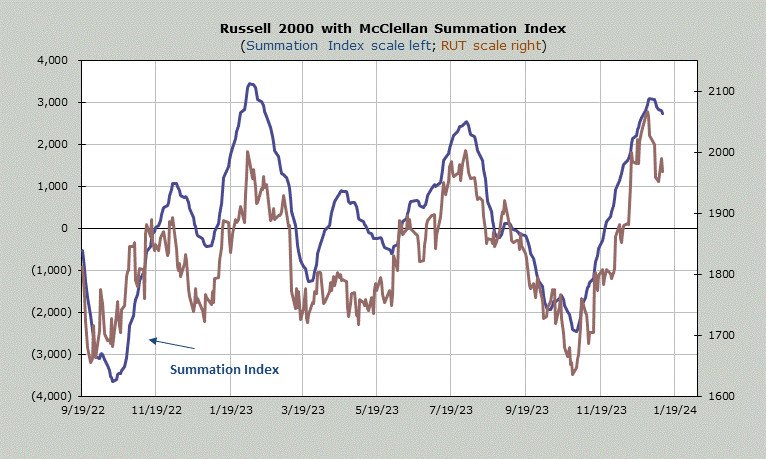
Down below you will see the McClellan Summation Index. It is still heading down, thus my comment that the majority of stocks have now turned down. It needs a net differential on the New York Stock Exchange of 1,700 advancers minus decliners.
The Hi-Lo Indicator has turned down enough that you do not need to squint to see it. Here is Nasdaq’s, but the NYSE is similar.
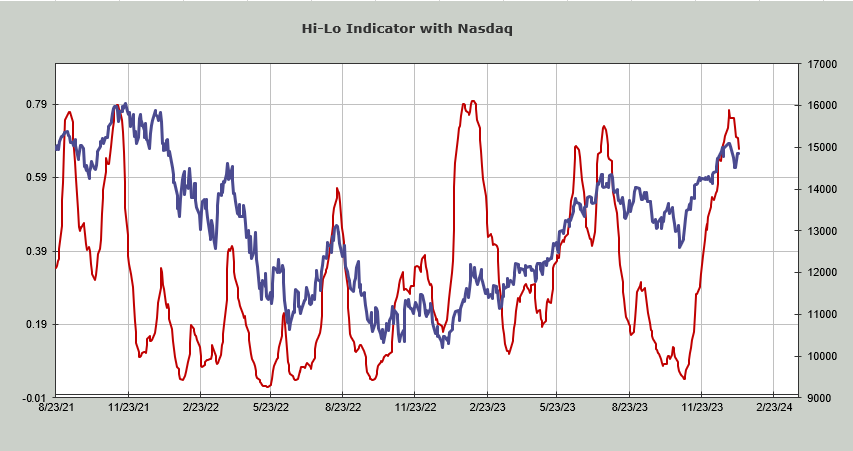
The bottom line is I still think we’re in a correction. It would be better if the whole market would correct together, rather than money flowing into those favored few index movers, because we do not want to see the indexes rise and the indicators fall. That is bearish.
New Ideas
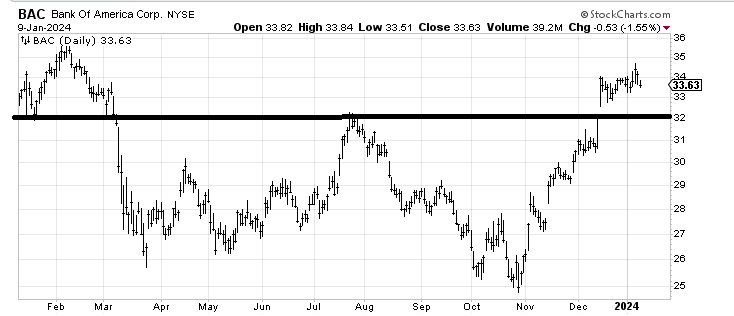
I want to reiterate that I think Bank Of America BAC should come down and fill that gap near $32. I know the banks are set to report earnings late this week/early next week, so I’ll be watching to see if it can get down there.
Today’s Indicator
The McClellan Summation Index is still heading down.
Q&A/Reader’s Feedback
Helene welcomes your questions about Top Stocks and her charting strategy and techniques. Please send an email directly to Helene with your questions. However, please remember that TheStreet.com Top Stocks is not intended to provide personalized investment advice. Email Helene here.
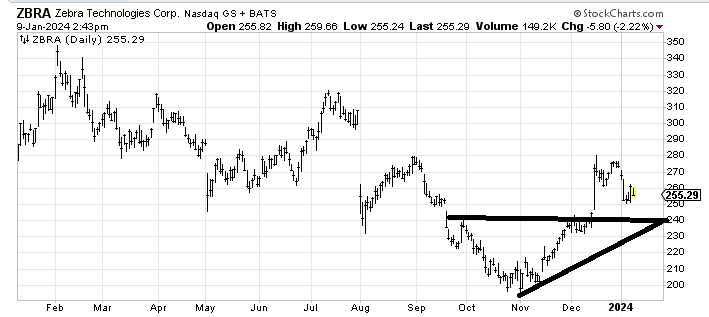
Showing Some Stripes: It’s possible I would take a look at Zebra Technologies ZBRA around $240 where there is support. Right here it is in the middle of nowhere. In fact, I’d probably look to get long if it came down to $240 a few weeks from now.
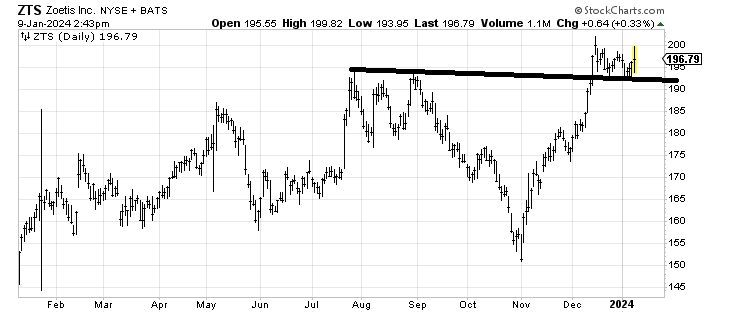
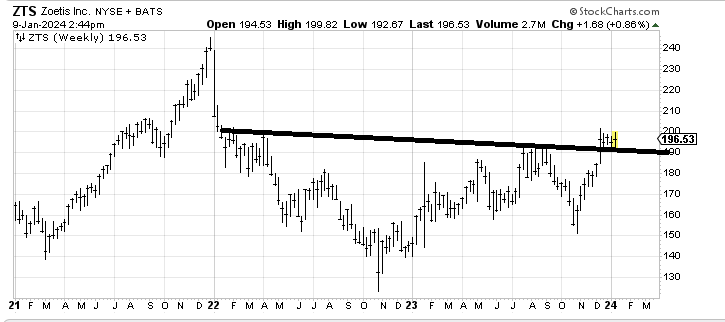
Zoetis Break Out: In the near term Zoetis ZTS looks to be consolidating its big up move from the October low. But let’s take a look at the longer term, 3-year, weekly chart. Because as long as this stock can hold $185-$190 or so, and then get up and over $200 that would be quite a breakout.
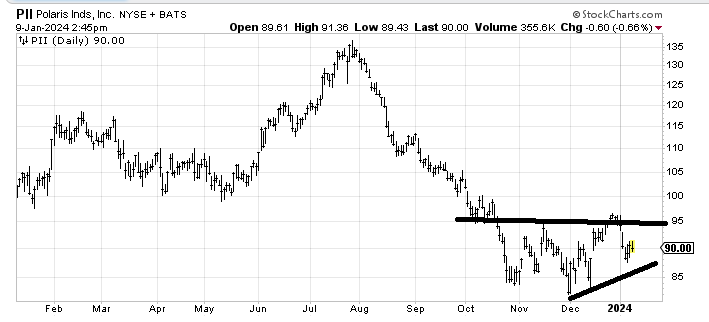
Gazing at Polaris: Polaris PII looks to me as if it will come down and tag that uptrend line. Then I’d have to see if it can hold $85 to determine if I would like it down there.
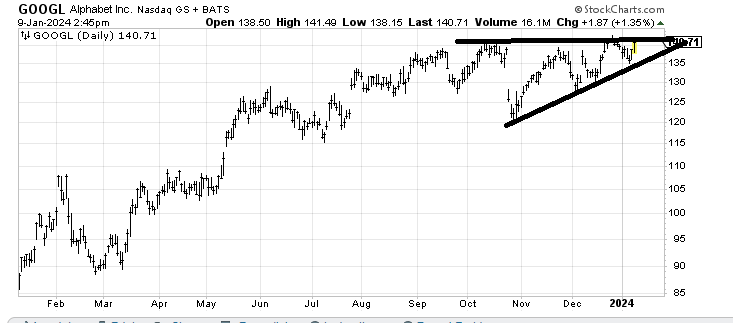
Seeking Alpha-bet: I recommended Alphabet GOOGL in mid-December and I still think the chart is good. I’d like to see it break out already. A move back under $135 turns me sour on it.
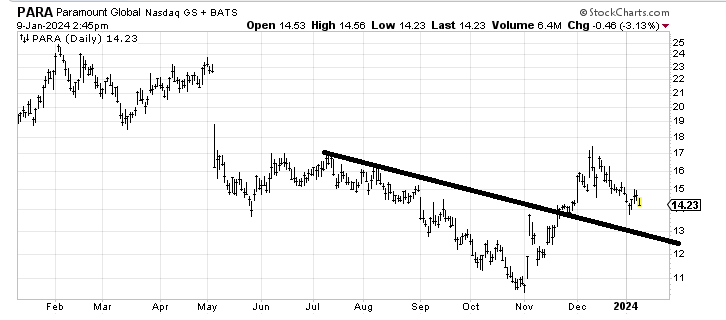
$13 Is 'Paramount': I would like to see Paramount PARA come down to tag that line around $13. It just feels like it would be a good shakeout down there.
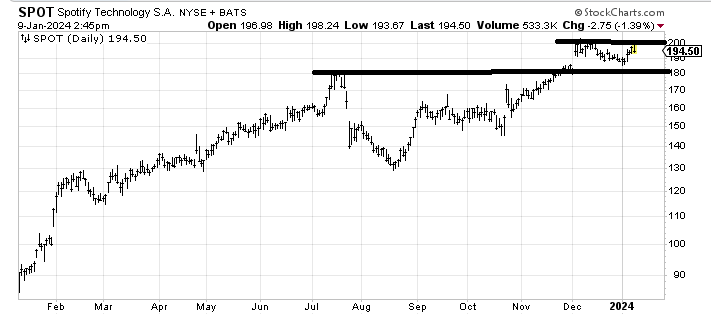
On Spotify: Spotify SPOT is not my type of chart, because it is up so much already. My preference would be to see it trade between $180-$200 for a month or so to give me a pattern that looks like it has legs (see Nvidia NVDA and GOOGL, having gone sideways for months).
Disclosures: None.
