A Bearish Sighting on Wall Street
We're finally seeing sentiment growling a bit, so let's look at the surveys and what to expect. Also, let's check the charts of Uber, Zebra and more.
You've reached your free article limit
You've read 0 of 1 free Pro articles.
The Market
Well, at least we’re finally getting some bearish sentiment.
I still really want to see the Investors Intelligence bulls fall. I believe next Wednesday’s report will show the bulls have pulled in their horns.
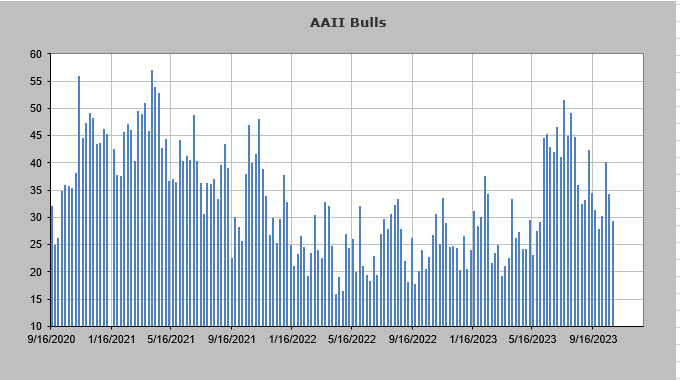
The American Association of Individual Investors pulled in their horns. Are they bearish? They are no longer bullish. Bulls fell five to 29.3%. Bears jumped 8.6 to 43.2% so the spread between the two is now the largest since May (-13 points). The peak reading in the spring was -20 in mid-March. That’s why I categorize it as not bullish anymore. Perhaps after today they might be closer to bearish.
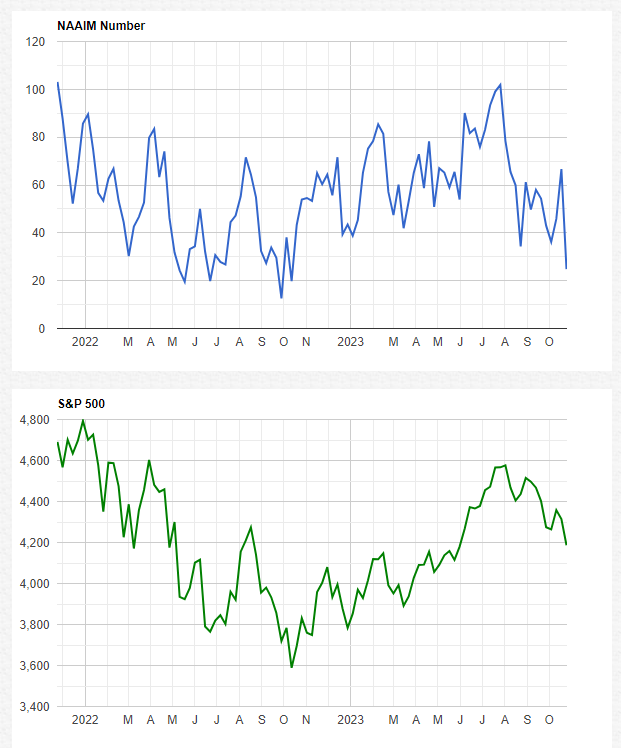
But the real change of heart came from the National Association of Active Investment Managers folks. Recall last week they had zipped their exposure up to 66, which was quite bothersome. Now they have collapsed it to 24. That is the lowest since they got to 12 a year ago. I consider this reading bullish in that they seem to have given up. Can they fall more? Yes, of course they can. But that’s quite a change of heart.
Then there is the Daily Sentiment Index. We’ve got the S&P at 14 and Nasdaq at 15. A down day Friday might not get them to single digits, but I consider readings under 15 to be "getting too bearish," while readings in the single digits are "too bearish."
With breadth positive today, fewer stocks are making new lows once again. And the S&P 500 has now been red for nine of the last 11 trading days. My Oscillator gets oversold (short term) sometime between now and midweek next week. I cannot pinpoint it better than that.
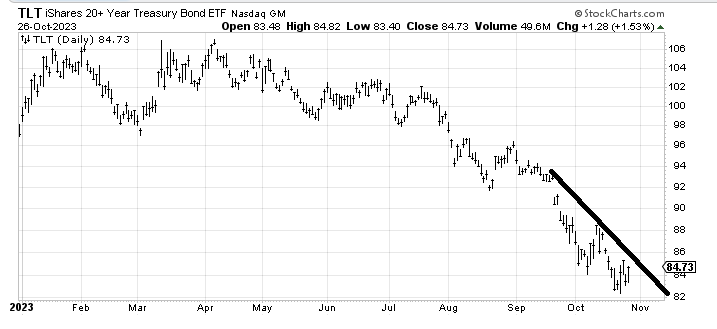
Bonds had a nice day, but let me point out once again that the bond fund TLT has got to cross that downtrend line or all this milling around for the bonds will be just a resting spot.
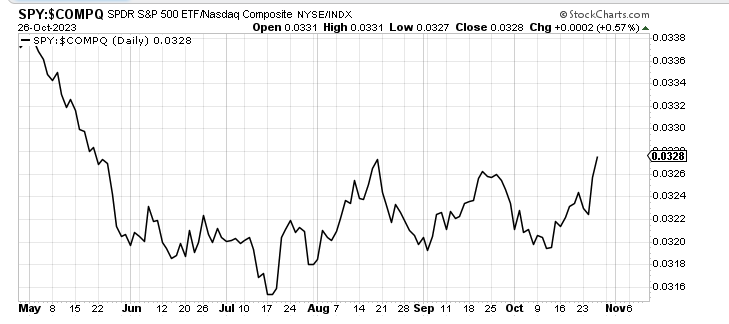
I will end with an update on the two charts I began the week with. First is the S&P to Nasdaq. It is inching its way to a higher high. On a longer-term basis this is not bullish.
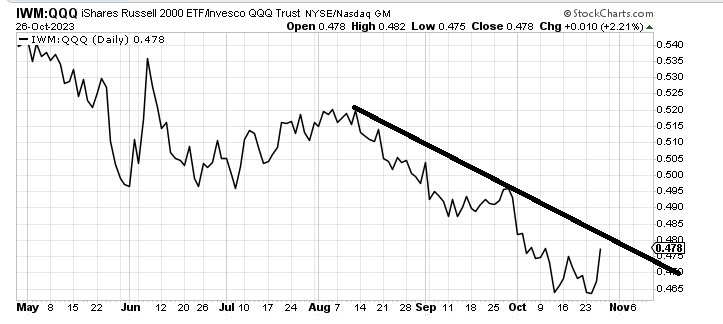
The other ratio chart is small cap fund IWM to the Invesco fund QQQ QQQ and that is trying to eke out a higher-high. On a short-term basis this is bullish if it can do it.
New Ideas
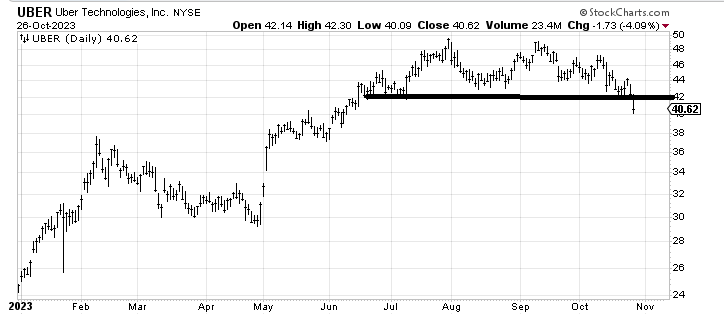
Uber UBER is finally breaking down. There is a near-term target $39-$40 and a more intermediate-term one, $32-$34.
If you want to play for a rally I would suggest you use an index.
Today’s Indicator
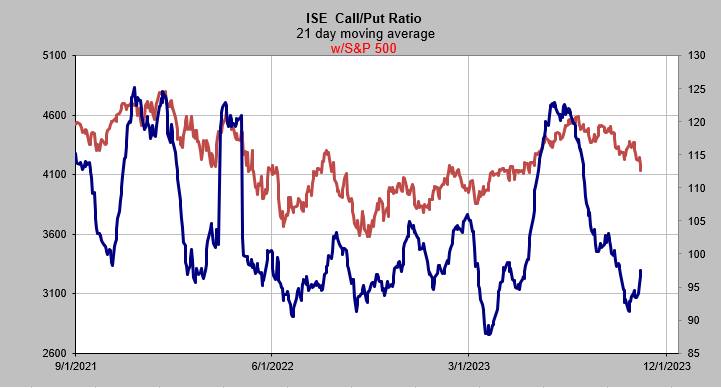
The International Securities Exchange's call/put ratio’s 21-day moving average is still heading up.
Q&A/Reader’s Feedback
Helene welcomes your questions about Top Stocks and her charting strategy and techniques. Please send an email directly to Helene with your questions. However, please remember that TheStreet.com Top Stocks is not intended to provide personalized investment advice. Email Helene here.
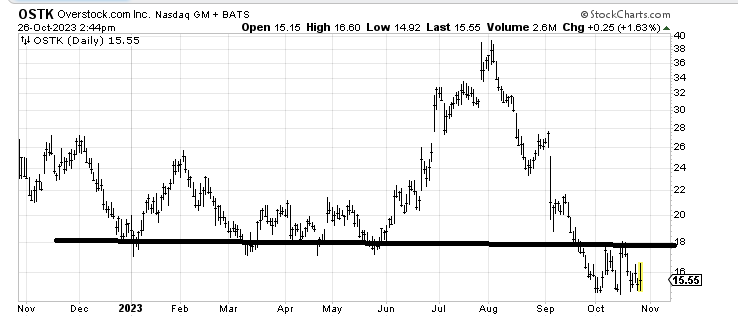
Overstock, Oversold: Overstock.com OSTK is oversold enough to rally, but even if it can get through $18 (first resistance) it has trouble up to $22. If you are really intent on buying for a longer term run then let a base build so you are sure — or at least more confident. Now it’s a trade to $18 or so.
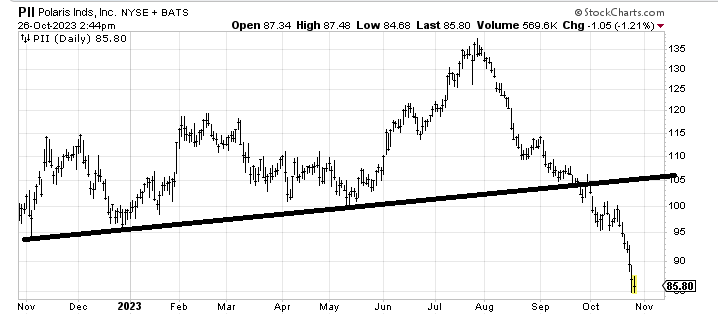
What's in the Stars for Polaris: Polaris PII is like many of the other stocks, oversold. There is a measured target in the mid-$60s. But it ought to bounce first, so if it can rally to around $95 I’d be a seller.
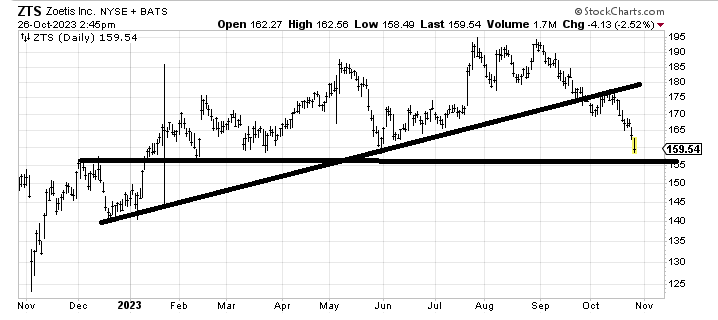
Zeotis in One Piece: Zoetis ZTS hasn’t even broken down yet. I would expect a rally from this support area.
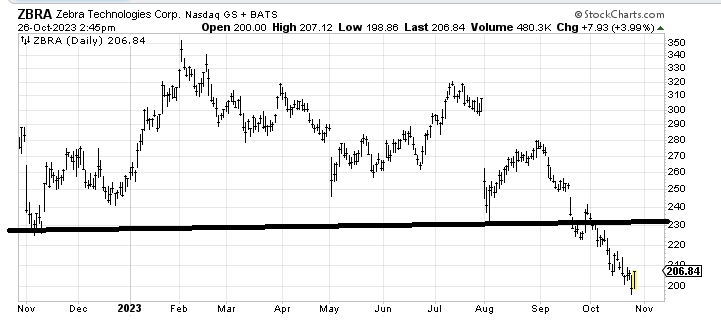
Zebra's Lines: Zebra Technologies ZBRA is also oversold enough to rally. If it gets back to the $220-$230 area I’d be a seller there.