Stock Charts Are Essential Trading Tools, But Are You Using Them Correctly?
Charts are often misused and misunderstood. Here is how I use them in my trading.
You've reached your free article limit
You've read 0 of 1 free Pro articles.
A stock chart is simply a graphic representation of a stock's price action. Sometimes, volume, moving averages, or other indicators are also shown on a chart, but they are nothing more than a snapshot of where a stock has been.
The conventional wisdom is that a chart will predict the future. Certain price patterns are deemed bullish or bearish, and technical traders are constantly looking for a setup that has worked in the past and provided gains.
The reality is that the best technical patterns fail quite often. There is no sure thing, and market conditions, news, and many other factors will undermine the value of a technical setup. Chart patterns are self-fulfilling to some extent since there are so many technical traders looking for similar patterns, but if pattern recognition was all that was needed for stock market success, then computers that identify patterns would control the financial world.
Charts do have some predictive value, especially when it comes to trends. As Sir Isaac Newton once said, a body in motion stays in motion until acted upon by an outside force. The same tends to be true of stocks. Once a trend is in place, it tends to continue until some outside news or information acts on it.
The Main Value of Stock Charts
The primary value of charts for most investors is as a trade management tool. A chart will provide a framework for buying, selling, and cutting losses. Rather than use a chart to try to predict what may happen in the future, a chart can be used to deal with the current action and put you in position for whatever the future might hold.
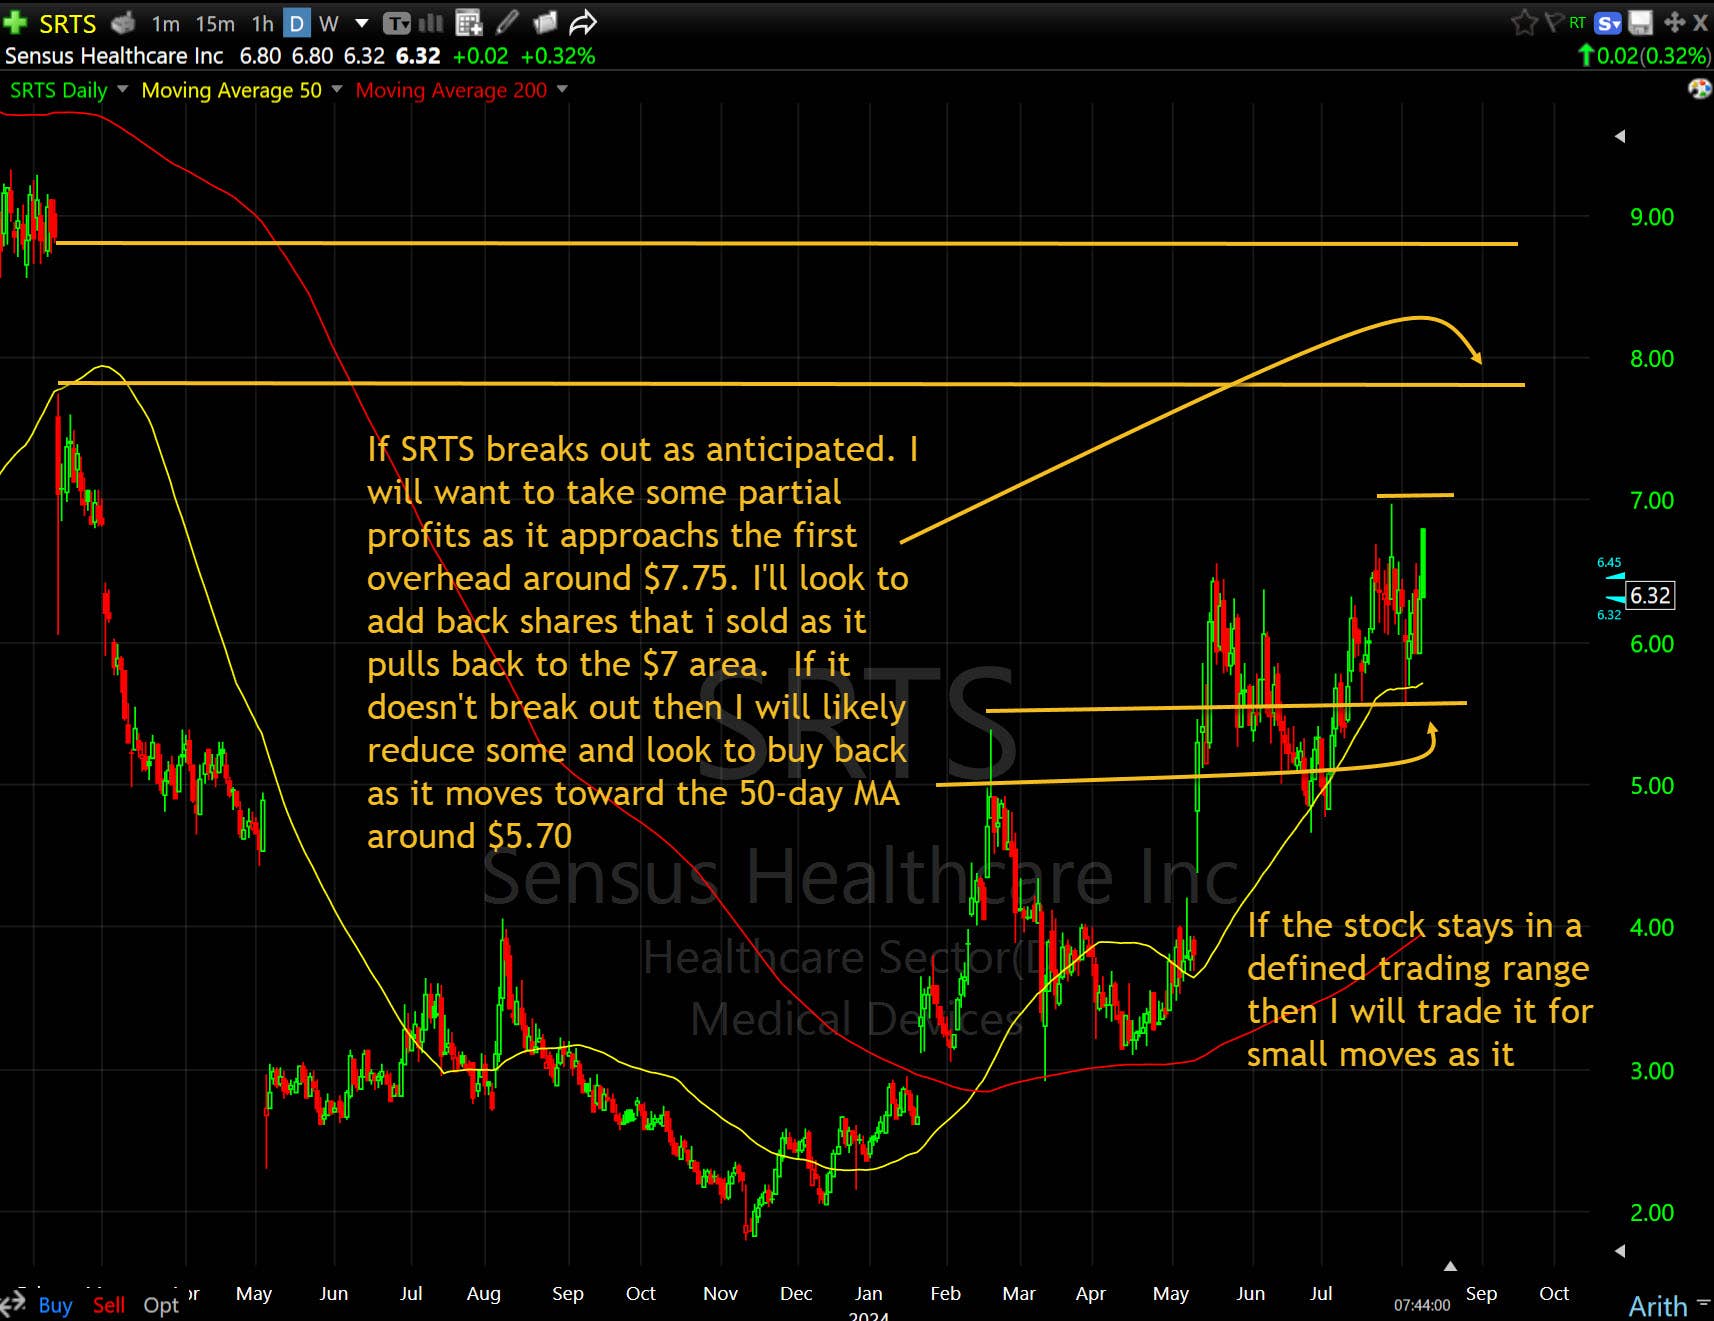
Here is an example of a stock that I'm currently trading.
Sensus Healthcare SRTS is a small company that sells medical equipment used to treat skin cancer, among other things. It had a strong earnings report in May and just announced another good quarter on Thursday night. I like the fundamentals and believe that the company is going to perform very well operationally.
I have been actively trading minor volatility and am currently holding a position. Based on the chart and the news, I believe that it is ready to break out over the $7 area. Obviously, I could be wrong, but how do I handle this trade as it develops?
Here is the chart:
The Framework for a Trading Plan
As you can see, I have a plan for a trade if it breaks out, as I think it will, I have a plan for a break of support, and I have a plan for a trading range. The chart provides the framework for everything that I do. My fundamental research provides confidence about valuation, and the price action on the chart creates a steady supply of trading opportunities.
Most traders would benefit greatly if they stopped thinking of charts as crystal balls that will tell the future. A large percentage of the time, price patterns do not work as expected. Good traders have to have a plan for whatever might happen, and therein lies the great value of charts.
More Trading Basics
- The Most Important Thing I've Learned in 25 Years of Trading
- Day Trading Is Very Difficult: Here Are 6 Tips for Long-Term Success
- Everything You Ever Wanted to Know About the CNN Fear & Greed Index
At the time of publication, Rev Shark was long SRTS.
Please note that due to factors including low market capitalization and/or insufficient public float, we consider SRTS to be small-cap stock. You should be aware that such stocks are subject to more risk than stocks of larger companies, including greater volatility, lower liquidity and less publicly available information, and that postings such as this one can have an effect on their stock prices.