Here's What Traders of Vertex Pharmaceuticals Should Do Now
Let's go over the charts and indicators.
You've reached your free article limit
You've read 0 of 1 free Pro articles.
Vertex Pharmaceuticals VRTX was rated a new fundamental outperform (buy) at Wolfe Research Thursday, with a $515 price target. VTRX engages in developing and commercializing therapies for treating cystic fibrosis.
Let's check out the charts and indicators.
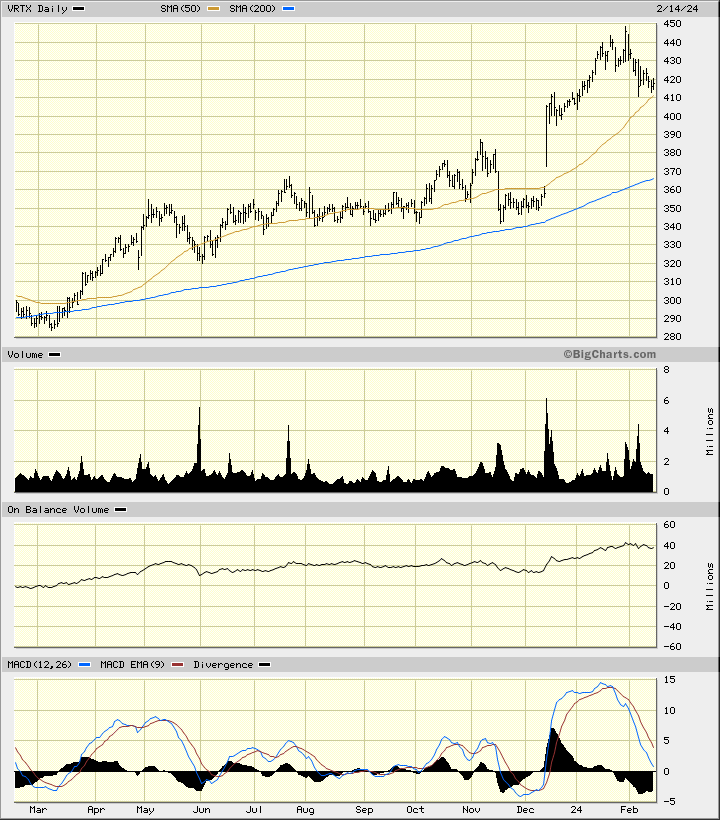
In this daily bar chart of VRTX, below, I can see that prices have moved higher over the past twelve months. Prices have pulled back in February towards the rising 50-day moving average line. The bullish 200-day moving average line inserts down around $365.
The On-Balance-Volume (OBV) line was neutral for much of 2023 but shows a rising move since early December. The Moving Average Convergence Divergence (MACD) oscillator has been correcting lower from around the middle of January but still stands above the zero line.
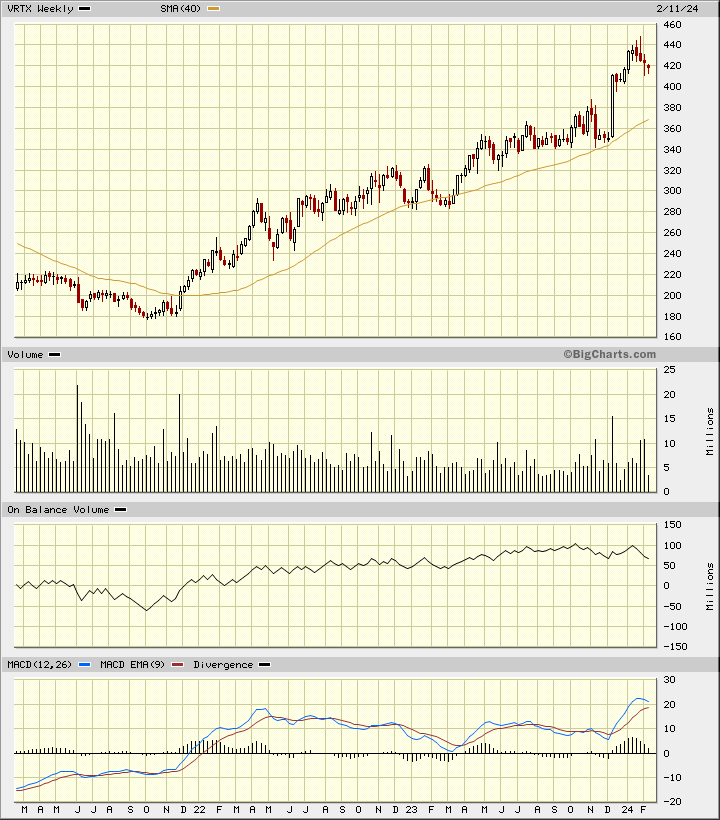
In this weekly Japanese candlestick chart of VRTX, below, I can see an impressive longer-term rally. Prices trade above the rising 40-week moving average line. The weekly OBV line shows strength until October and then it struggles to move higher.
The MACD oscillator is above the zero line but it has been narrowing in recent weeks telling us that the trend strength is waning. Some upper shadows in January suggest that traders are rejecting the highs.
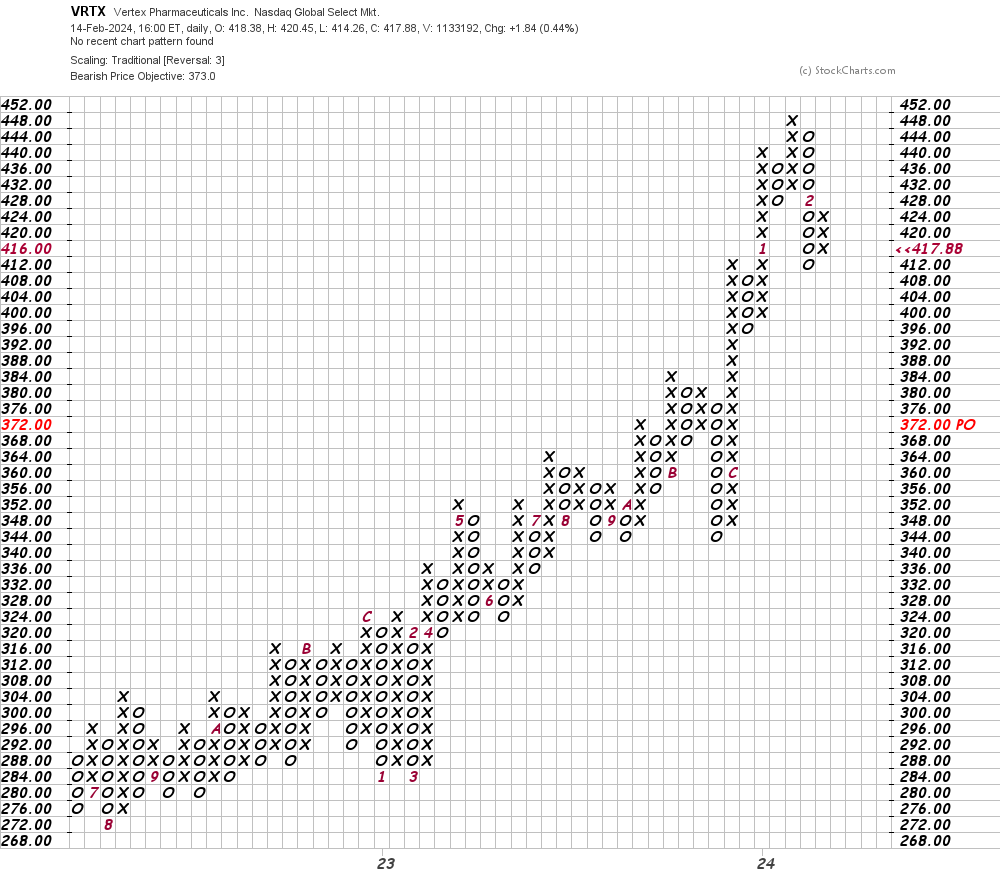
In this daily Point and Figure chart of VRTX, below, I can see a potential downside price target in the $373 area.
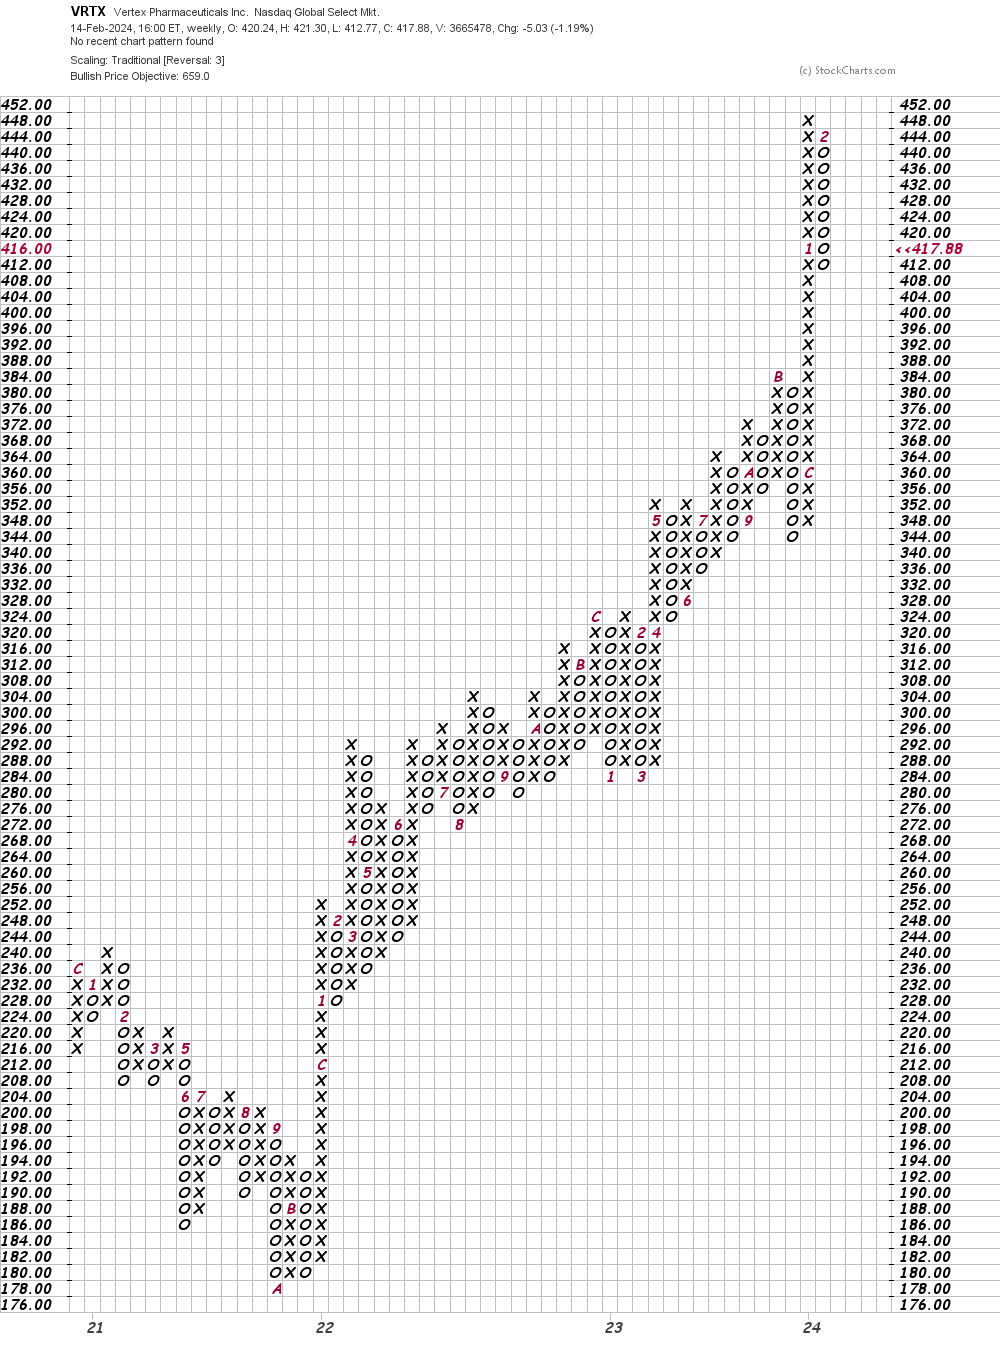
In this second Point and Figure chart of VRTX, below, I used weekly price data. Here the software yields an upside price target in the $659 area.
Bottom line strategy: I recommended the long side of VRTX back on December 13. Traders should hold existing longs and raise sell stops to $395. Add to longs above $430.
Employees of TheStreet are prohibited from trading individual securities.