Has the Second Leg of the Commodity Bull Market Started?
Here's why this is important for investors to ponder.
You've reached your free article limit
You've read 0 of 1 free Pro articles.
In my 2024 forecast article I wrote about a secular bull market in commodities. I have included part of that discussion below.
A Decade of Shortages
I talked about this in a "think piece" a number of years ago. I see commodities in a new secular bull market.
Historically, commodity bull markets come from supply shocks. Demand for commodities tends to change slowly over time but since 2000 we have seen 50 million people per year added to the billions on planet earth. Since 2000 we have seen hundreds millions of people move into the middle class and that is fueling demand that we have never seen before.
This insatiable demand is hitting up against stagnant supplies of food and materials. I anticipate that commodities will be rationed by price in the years ahead. I look for commodity prices to turn upwards again from August 2024.
Reviewing the charts of the commodity ETFs DBC and DBA this Wednesday I believe that we may have started a move higher sooner than my August 2024 timetable.
Let's check.
The agricultural index is ripping higher. This is likely going to provide a boost to food prices going forward. The chart of DBA is below. This is the Invesco DB Agricultural fund, which tracks the index. Within the DBA four commodities have the biggest weights -- Cocoa 21.66%, Live Cattle 11.85%, Coffee 10.87% and Soybeans 10.41%,
Now let's check out some charts.
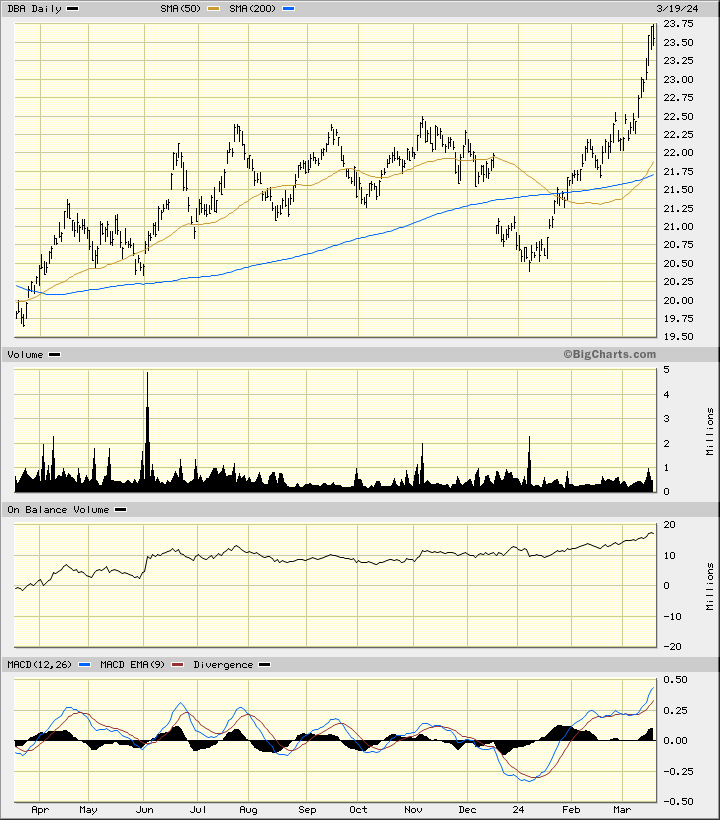
In this daily chart of the DBA, below, I can see a strong move to the upside starting in January. Prices trade above the rising 50-day moving average line and above the bullish 200-day line. The On-Balance-Volume (OBV) line is rising and the Moving Average Convergence Divergence (MACD) oscillator is bullish.
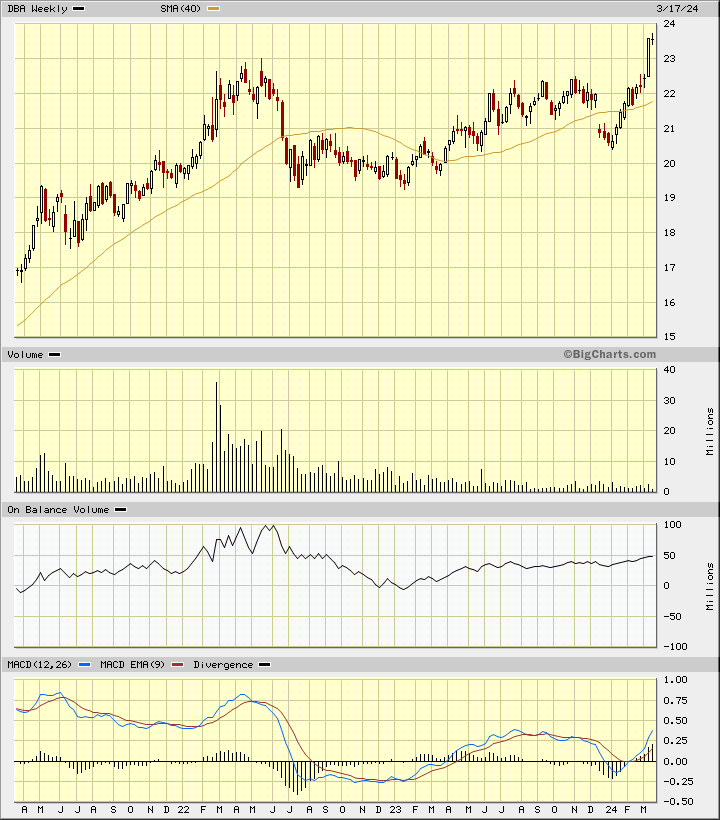
In this weekly Japanese candlestick chart of DBA, below, I can see that prices have broken above the highs of 2022. DBA trades above the rising 40-week moving average line. The trading volume is light but the trend of the OBV line is positive. The MACD oscillator is bullish.
In this daily Point and Figure chart of DBA, below, I can see an upside price target in the $37 area.
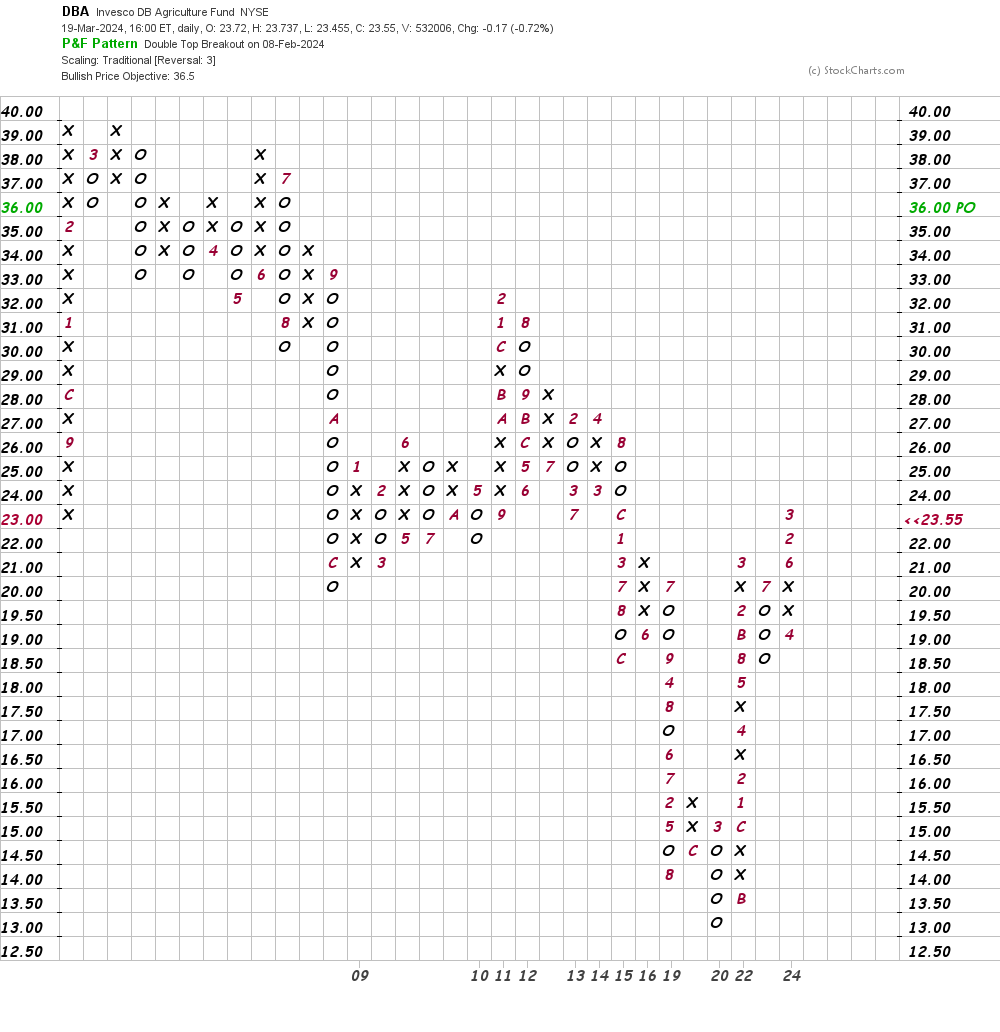
In this weekly Point and Figure chart of DBA, below, I can see the same $37 price objective as shown on the daily chart above.

Drilling down on the DBA I have four charts below.
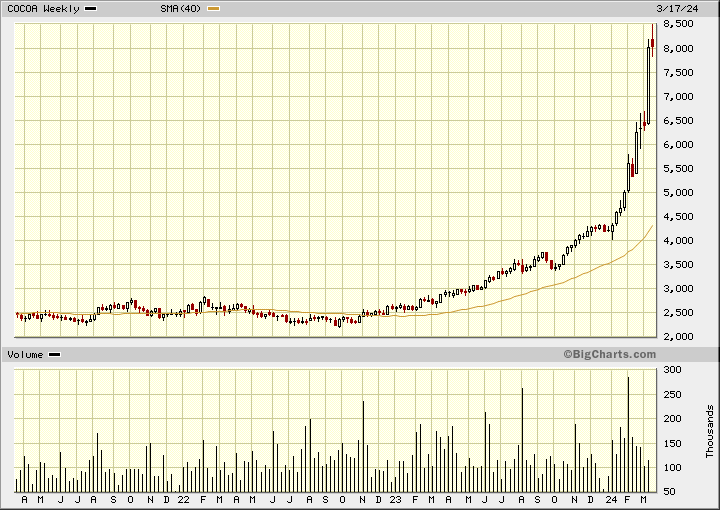
In this weekly Japanese candlestick chart of cocoa futures, below, I can see a powerful advance.
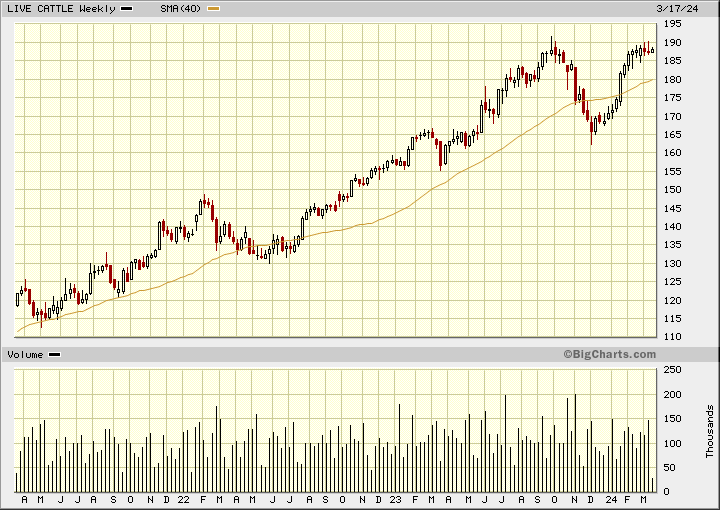
In this weekly Japanese candlestick chart of live cattle futures, below, I can imagine paying more for hamburgers this summer grilling season.
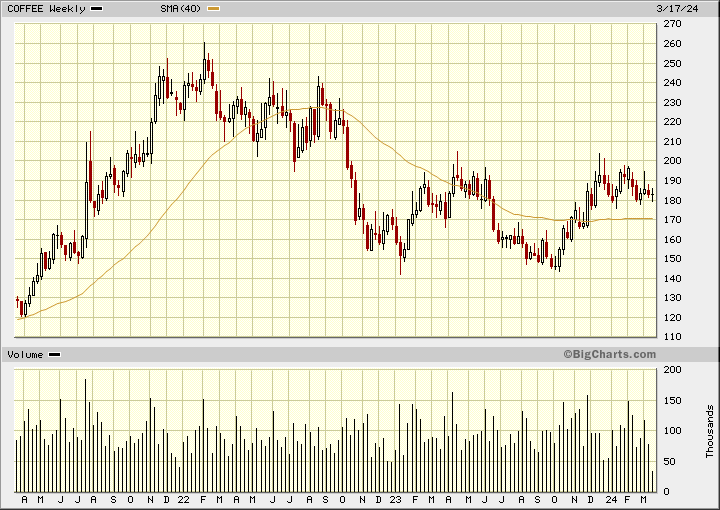
In this chart of coffee futures, below, I think the risk could be for higher prices in the months ahead.
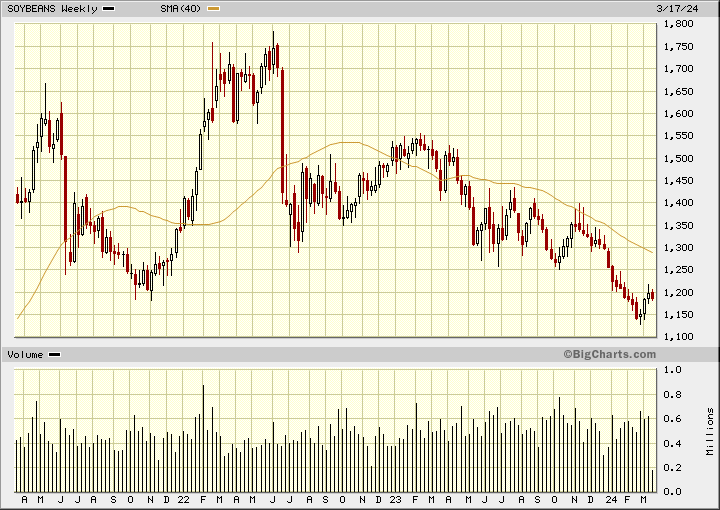
In this weekly chart of soybean futures, below, I can see a significant decline. Will mother nature and the weather deliver a large crop this coming year?
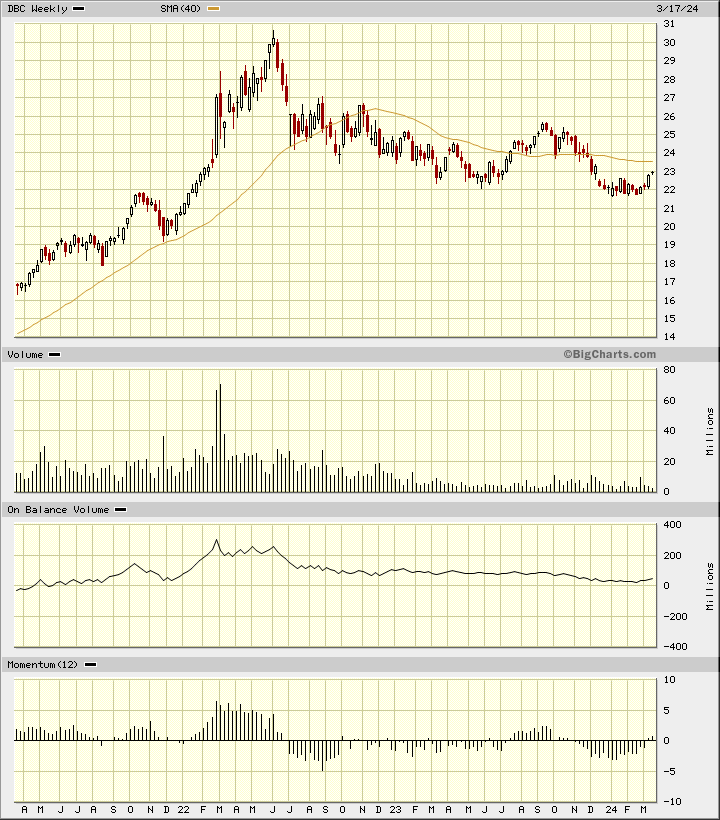
The weekly chart of DBC, the Invesco DB Commodity Index Tracking Fund, below, shows me a bullish setup and the risk of higher prices in the months ahead. Keep a close watch on copper prices.
Bottom-line strategy: For the next several months you should read the Wall Street Journal from back to front. Stories about commodities will be near the back of the WSJ. Rising costs for food and materials could push interest rates higher as we move through the year. Higher interest rates could prove to be a headwind for equity prices.
Employees of TheStreet are prohibited from trading individual securities.