My 2024 Market Forecast: I'm Not Running in This '5K Race'
Here's a peek inside all the market's 'tents', including stocks, bonds, sectors, gold, commodities, bitcoin and more. One thing is for sure -- traders and investors will need to be nimble in 2024 and beyond.
You've reached your free article limit
You've read 0 of 1 free Pro articles.
There are two old sayings that I like and I think they have some relevance today.
The first one you may have heard before: " The markets move in the direction to frustrate the greatest number of people." If too many people believe the same thing and act on it you can easily get a reversal as lopsided positions become risky. More on this in a few minutes.
The second is "If you truly seek wisdom you will visit every tent in the marketplace." This is a very old Mideast saying . What does it mean? I think it is telling us that you need to keep an open mind and embrace fundamental analysis, quantitative analysis and even technical analysis. You also need to assess the geopolitical risks we confront today.
As I think about the stock market today I get a sense that way too many people believe we are going to have a soft landing, but to me, this seems to be more hope than anything that people have solid evidence for.
Too many people and money managers are indexing and they have piled into positions in the so-called "Magnificent Seven." This concentration of money is probably bigger than the Nifty 50 in 1973 and the technology names in 2000. These prior concentrated positions ended badly. Just saying.
It's OK Till It's Not OK
What happens when so many people agree on an outlook and it doesn't happen? If the economy turns out to be weaker than anticipated then stocks are likely to decline. If the economy turns out to be stronger than anticipated then interest rates would probably rise and the bond vigilantes will rule.
First-Quarter Reversals
From time to time I have cited my use of cycles as calculated by www.pfr.com. This firm anticipates turns for stocks in early January and early February. With the U.S. stock market "priced for perfection" the risk is that any disappointment could precipitate a deep decline in stock prices. More on this in a little while.
Geopolitical Risk
A few weeks ago the world lost Henry Kissinger. This got me thinking that we don't really have the kind of high-level people to solve problems we used to have. We have entered an era where we build consensus with other countries. I see that with Russia and Ukraine. Sadly, I think Ukraine has basically lost the battle.
The New York Times suggests that "Troop Deaths and Injuries in Ukraine War Near 500,000, U.S. Officials Say." Remember that the U.S. lost around 420,000 in World War II. Support in Congress is iffy at best now and that could embolden Vladimir Putin. This is not my area of expertise, just my two cents.
Israel is another big risk with Iran. The U.S. could easily get dragged into this conflict and Russia too. Experts like Dan Yergin will point out the risk to oil supplies if this unfolds. There is no lack of bad actors who are looking to attack the U.S.
China? A lot of observers worry about China invading Taiwan but they would probably rather do business than go to war. However, they can be provoked. Again, just my two cents.
Is this technical analysis? No, but it is on my mind. I like to visit all the tents.
Let's Examine Some Charts
Bitcoin Futures
I rarely write about the world of cryptocurrency, but I am starting off with this weekly continuation futures chart of Bitcoin. Many people are anticipating a bitcoin ETF and this reminds me of the start of U.S futures trading in gold in 1974. Prices rallied right up until the start of trading and then promptly sold off. Buy the rumor and sell the news?
Prices are trading at a 50% premium to the 200-day moving average line and that is entering the realm of extended. The most recent high was made on weaker price momentum for a bearish divergence
The Dollar Index
The DXY is headed lower as the yield on the 10-Year Treasury declines but a move higher should not be ruled out if rates go up again later in 2024.
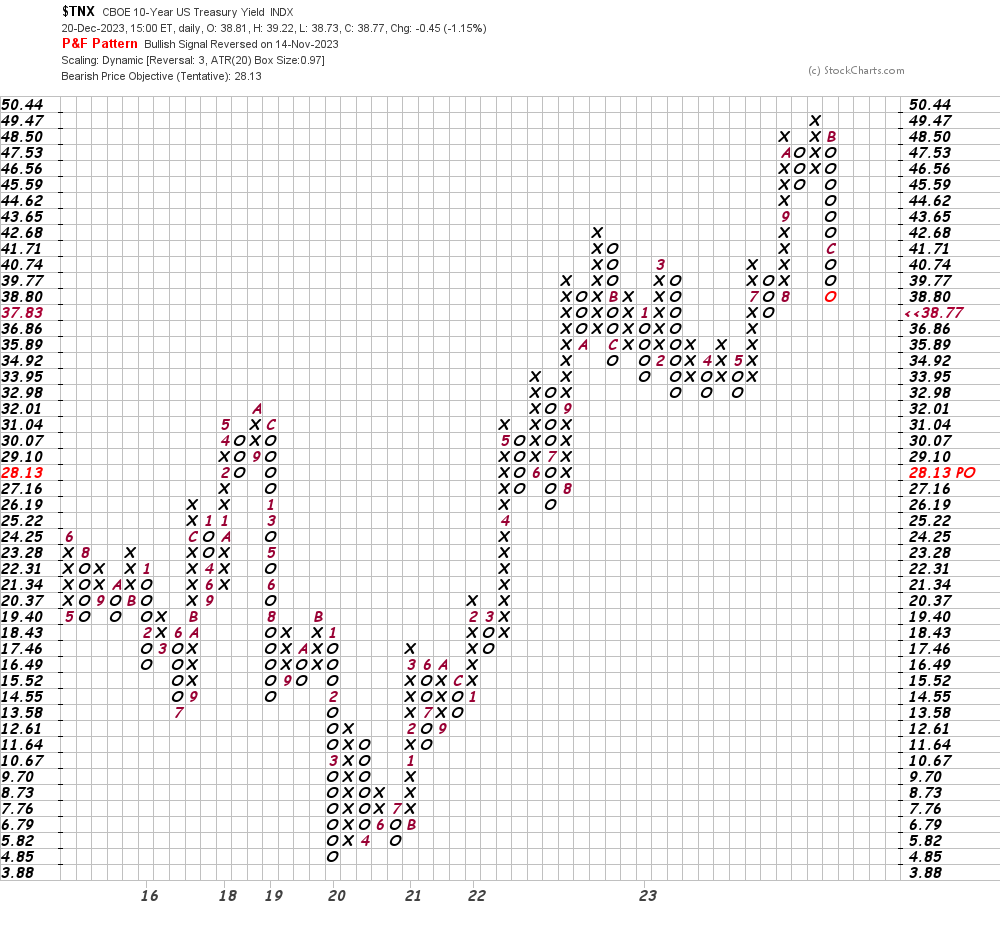
The 10-Year Treasury Yield
The 10-Year Treasury yield could fall to the 3.70% area or a touch lower in the short-run but falling rates are only bullish for stocks if there is a soft landing. Maybe we could see 3% or slightly lower by the third quarter 2024 before the rates start rising again along with commodity prices as commodities are in a secular bull market.
The Point and Figure chart of the 10-year yield, below, shows us a target in the 2.81% area.
China Stays Weak
In this monthly candlestick chart of the large-cap Chinese stocks ETF, the FXI , below, we can see that the major trend is down with no hints of a bottom yet.
A Decade of Shortages
I talked about this in a "think piece" a number of years ago. I see commodities in a new secular bull market.
Historically, commodity bull markets come from supply shocks. Demand for commodities tends to change slowly over time but since 2000 we have seen 50 million people per year added to the billions on planet earth. Since 2000 we have seen hundreds millions of people move into the middle class and that is fueling demand that we have never seen before.
This insatiable demand is hitting up against stagnant supplies of food and materials. I anticipate that commodities will be rationed by price in the years ahead. Below, I show you the charts of two commodity ETFs -- DBC and DBA . I look for commodity prices to turn upwards again from August 2024.
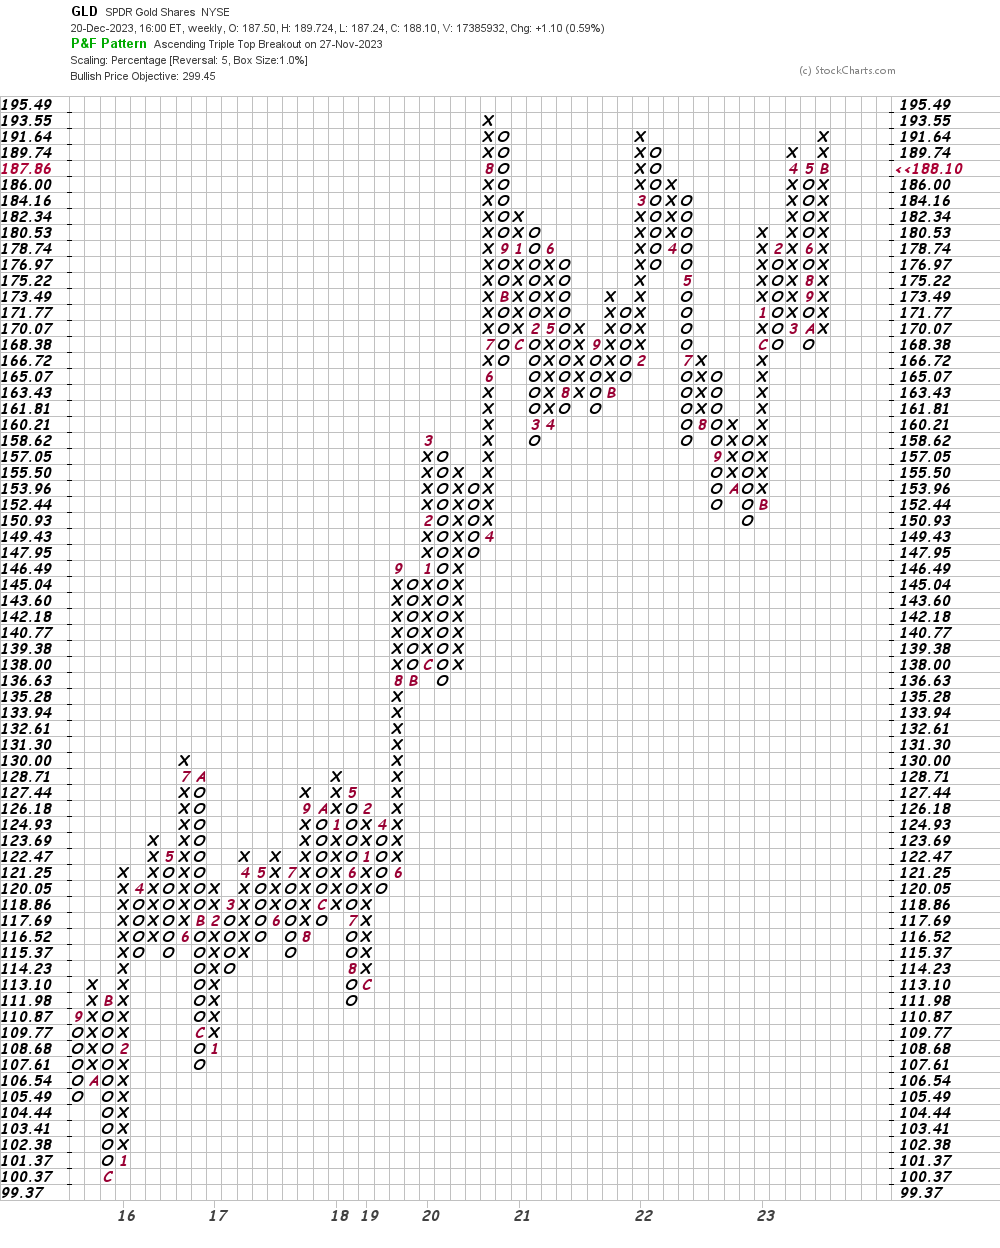
Gold
Gold prices are close to an upside breakout that sticks.
In this monthly Japanese candlestick chart of the GLD , below, I can see that a monthly close above $190 should precipitate further gains.
In this weekly Point and Figure chart of the GLD, below, I used a five-box reversal filter. Here the software gives us a price target in the $300 area.
Remember that Point and Figure charts ignore time so this price target may not be reached in 2024 but more likely 2025 or later.
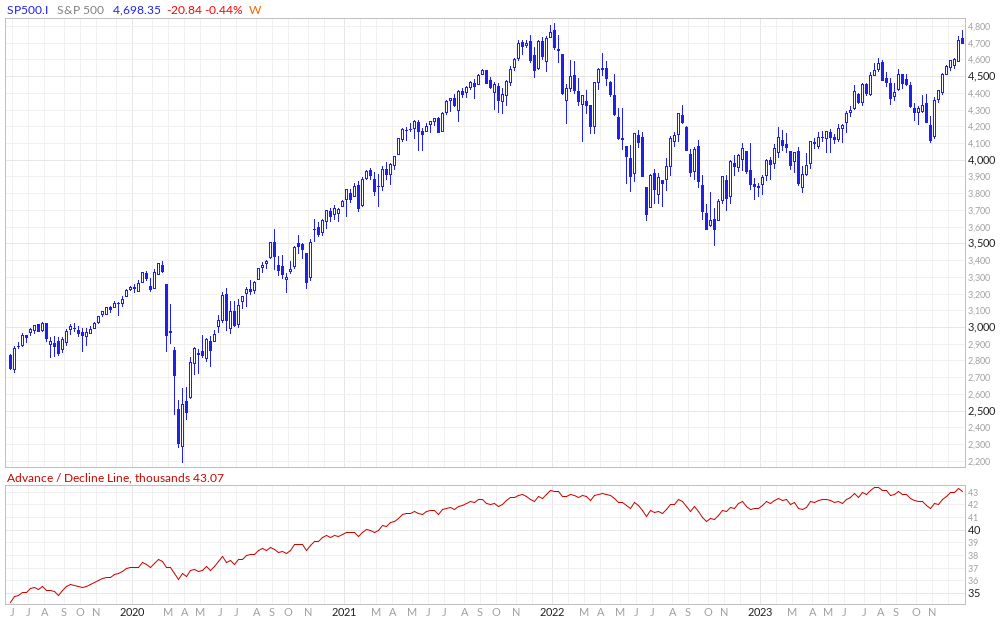
Stock Prices and Advance/Decline Lines
This first weekly Advance/Decline line is for the S&P 500 going back four years. Prices have recovered from the nadir of 2022 and are knocking on a new all-time high but the breadth numbers have moved sideways the past two years.
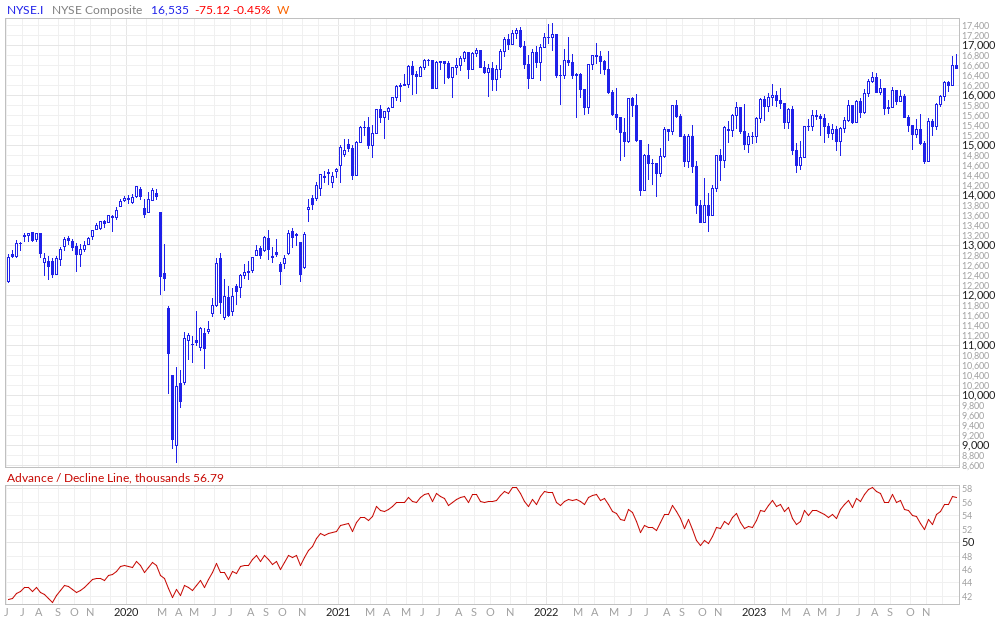
In this second chart I present the NYSE Composite Index (all the stocks listed on the NYSE) and its Advance/Decline line. A similar story with a broader index.
The 11 Sectors
Regular readers of my articles on Real Money Pro over the past seven plus years know that I consider that a sustainable bull market is in force when there are six or seven sectors trading above the rising 200-day moving average line and 30-40% of the stocks in those sectors have turned to the upside.
Let's review the 11 S&P sector ETFs.
Look for yourself but I only see five sectors trading above their rising 200-day moving average lines -- XLK , XLV , XLY , XLC and XLI .
Information Technology XLK
Health Care XLV
Financials XLF
Consumer Discretionary XLY
Communication Services XLC
Industrials XLI
Consumer Staples XLP
Energy XLE
Utilities XLU
Real Estate XLRE
Materials XLB
Sentiment
I see sentiment as way too bullish. Forget surveys and option ratios and Commitment of Traders and other tools presented by analysts on TV, what strikes me now is that I have gotten way too many email invitations to follow "experts" I never heard of before. I know that is anecdotal but give me a break.
One theme I believe will shift from 2023 to 2024 is around artificial intelligence (AI). AI has both captured investors' hearts and minds, and contributed to the outperformance of both the Magnificent Seven and technology stocks more broadly. I believe a theme in 2024 will be less about AI's "creators" and more about AI's "adopters" as companies increasingly focus their capital spending on productivity enhancing investments. These stocks could be the new leadership for gains in late 2024 and 2025. No names for you at this point in time.
Price Targets for the S&P 500
I anticipate that the market, as measured by the S&P 500, will make its 2024 high early in the first quarter. The downside low could be seen in the late third quarter and could break below the lows made in 2023.
There have been a number of years when both a key high and low were made in the same year -- 2000, 1973, 1962, 1937 to name four.
Bottom-Line Strategy
The Chinese calendar uses animals to describe the year ahead but I will use just one word "nimble." Traders and investors will need to be nimble in 2024 and beyond.
I believe buy and hold has not returned and the 60-40 portfolio will disappoint. Timing and direction will be more important than price targets. Continue to explore the tents in the marketplace.
Employees of TheStreet are prohibited from trading individual securities.