Has Alcoa Been Dented Enough to Get Investors Interested?
Here's when buyers could get interested.
You've reached your free article limit
You've read 0 of 1 free Pro articles.
Alcoa Corp. AA is a major producer of primary aluminum, fabricated aluminum, and alumina combined. The shares have been cut in half in the past year so let's see if investors now find the stock attractive.
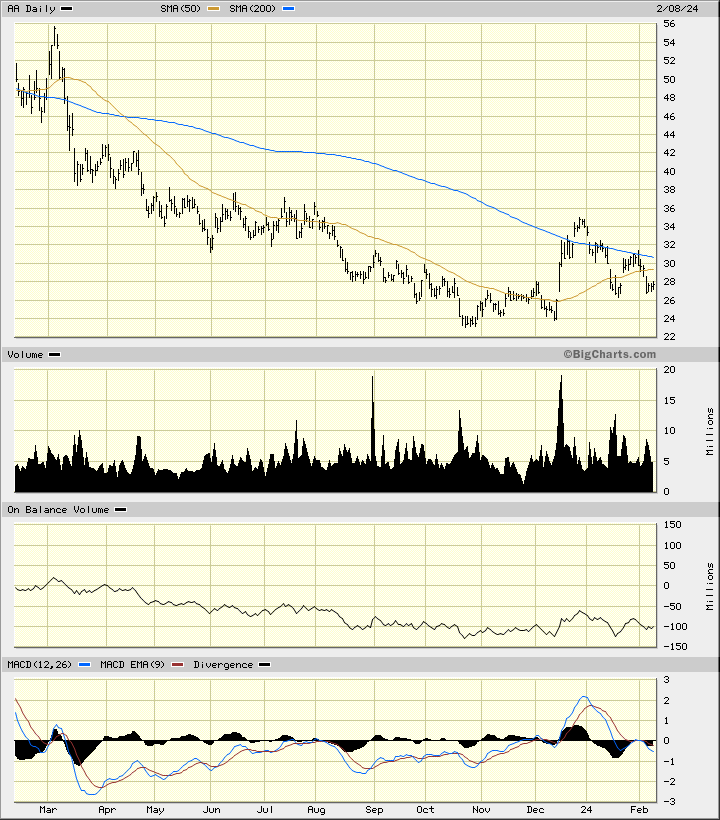
In the daily bar chart of AA, below, I can see that the shares have made a low in October and a slightly higher low in December to start the bottoming process. AA traded nicely higher in December but has corrected back below the 50-day and 200-day moving average lines.
The On-Balance-Volume (OBV) line has been bouncing around since making a low in October. The trading volume has been more active since December. The Moving Average Convergence Divergence (MACD) oscillator is slightly below the zero line.
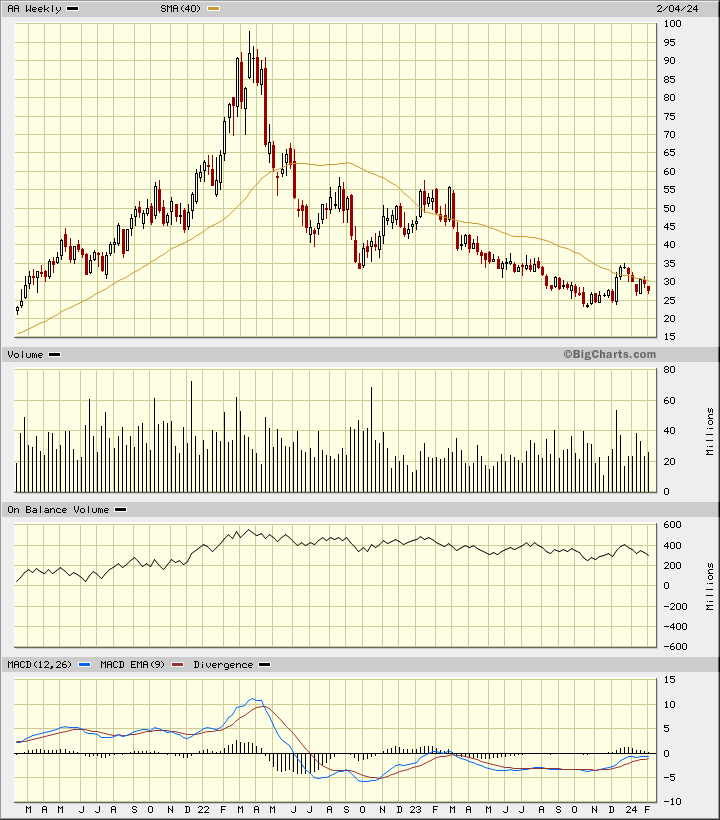
In the weekly Japanese candlestick chart of AA, below, I can see that the shares made a serious decline from early 2022. The stock has spent a lot of time below the declining 40-week moving average line but things are changing. AA is now just slightly below the 40-week line.
The weekly OBV line is up from its late October nadir. The MACD oscillator is slightly below the zero line.
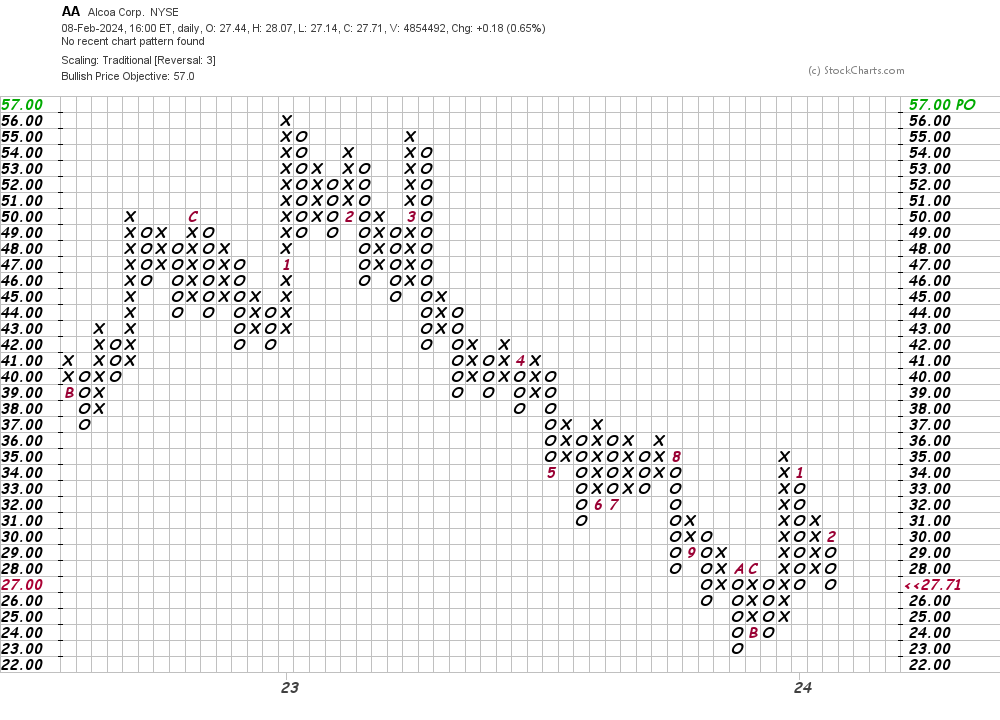
In this daily Point and Figure chart of AA, below, I can see that the software suggests an upside price target in the $57 area.
In this weekly Point and Figure chart of AA, below, I can see the same $57 price target as the daily chart above.
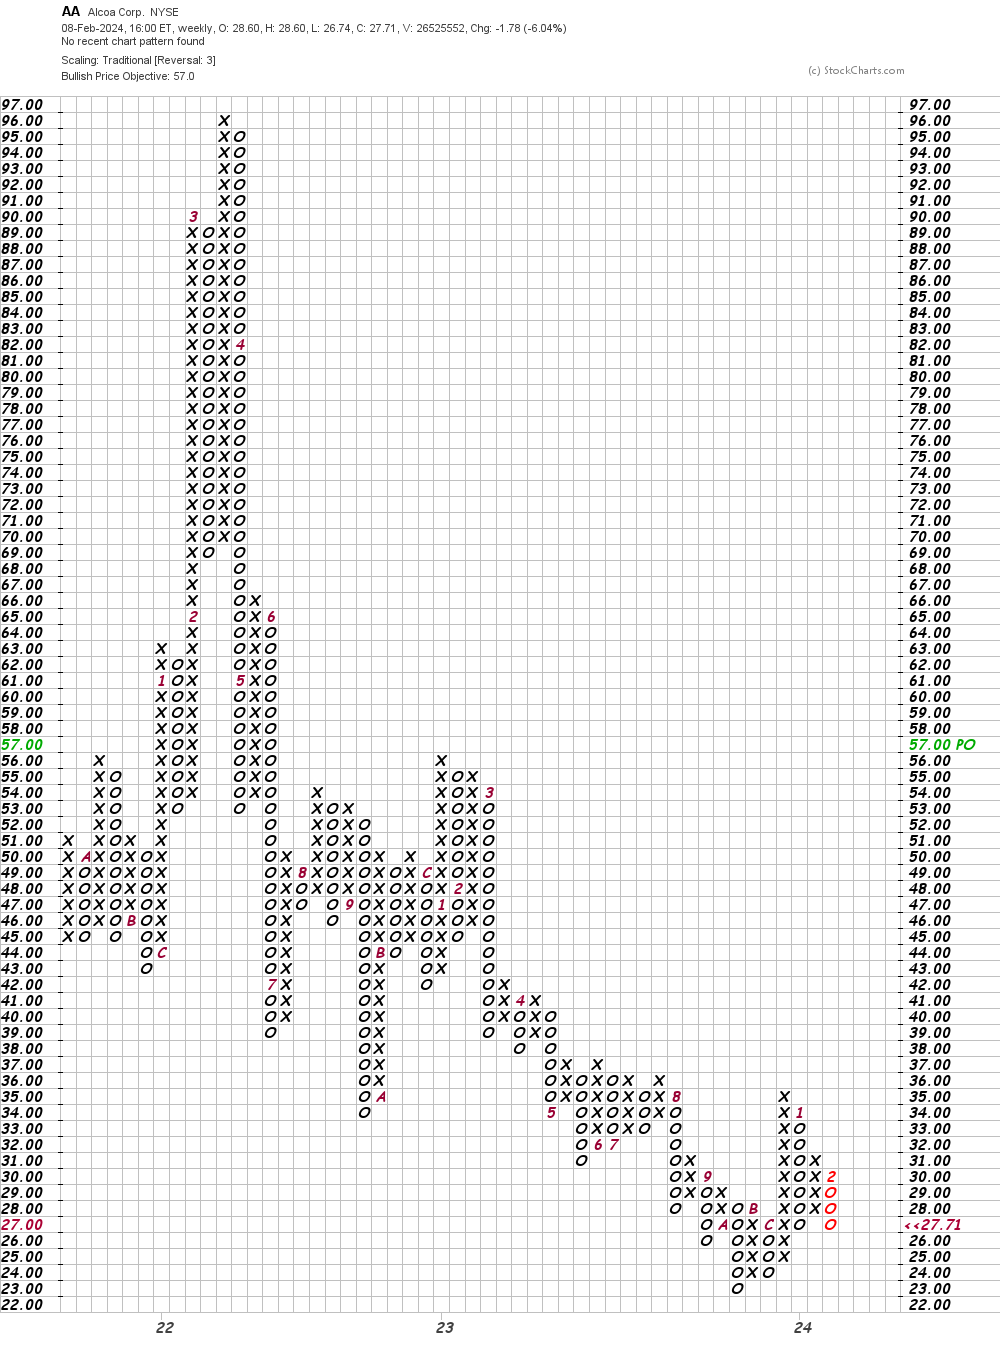
Bottom-line strategy: Buyers of AA showed up in the $24 area in October and December. Patient investors should wait for a retest of the $24 area in the weeks ahead before purchasing. Risk $3 from entry. The $57 area is our Point and Figure price target.
Employees of TheStreet are prohibited from trading individual securities.