Can Marathon Petroleum's Rally Continue?
There are questions and we see answers.
You've reached your free article limit
You've read 0 of 1 free Pro articles.
Integrated downstream energy company Marathon Petroleum Corp MPC has rallied strongly since early June. Can the rally continue? What price targets might we "see"? What stop loss order makes sense?
Let's check out the charts for some answers.
In this daily bar chart of MPC, below, I can see that prices are trading above the rising 50-day moving average line and above the rising 200-day line. The daily On-Balance-Volume (OBV) line has firmed since June to confirm the price gains. The Moving Average Convergence Divergence (MACD) oscillator has been hugging the zero line but looks poised to turn upwards to a new outright buy signal.
In this weekly Japanese candlestick chart of MPC, below, I can see a very impressive advance over the past three years. Prices trade above the rising 40-week moving average line. Declines to the 40-week moving average line have proved to be buying opportunities. The weekly OBV line shows a slow and steady rise. The MACD oscillator is above the zero line but it has narrowed sharply in weeks as MPC made a consolidation pattern.
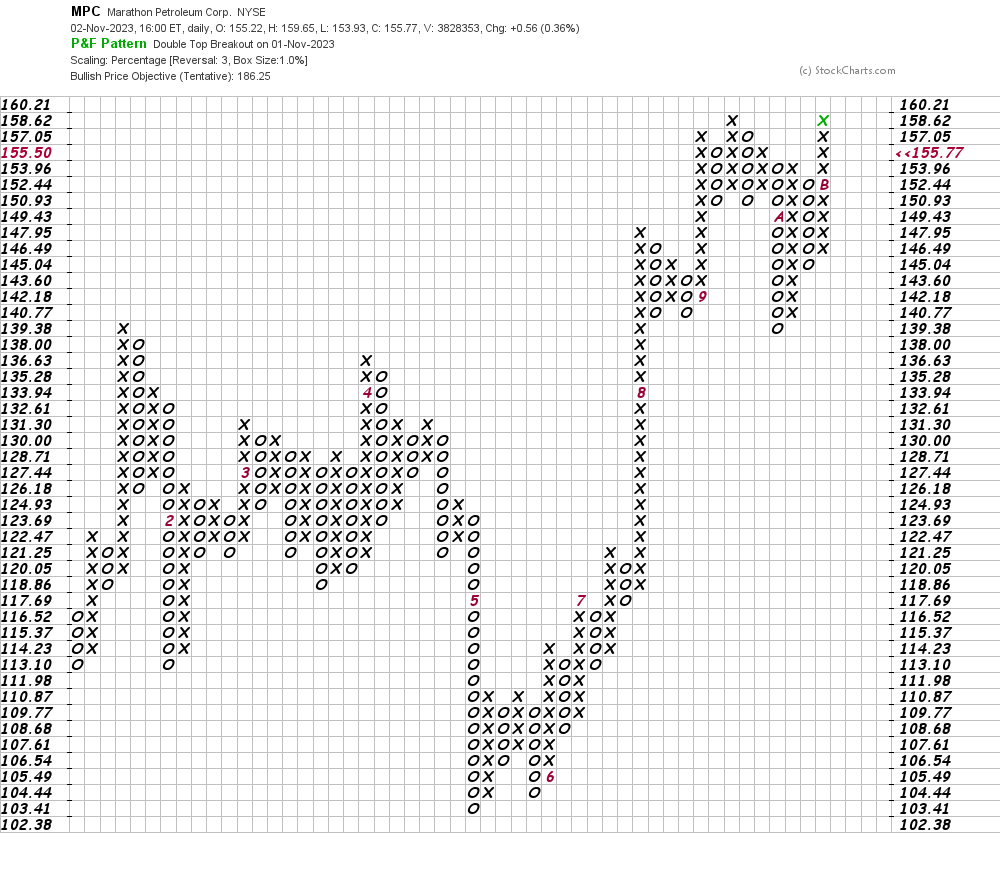
In this daily Point and Figure chart of MPC, below, I can see a price target in the $186 area. A trade at $160.21 will refresh the uptrend.
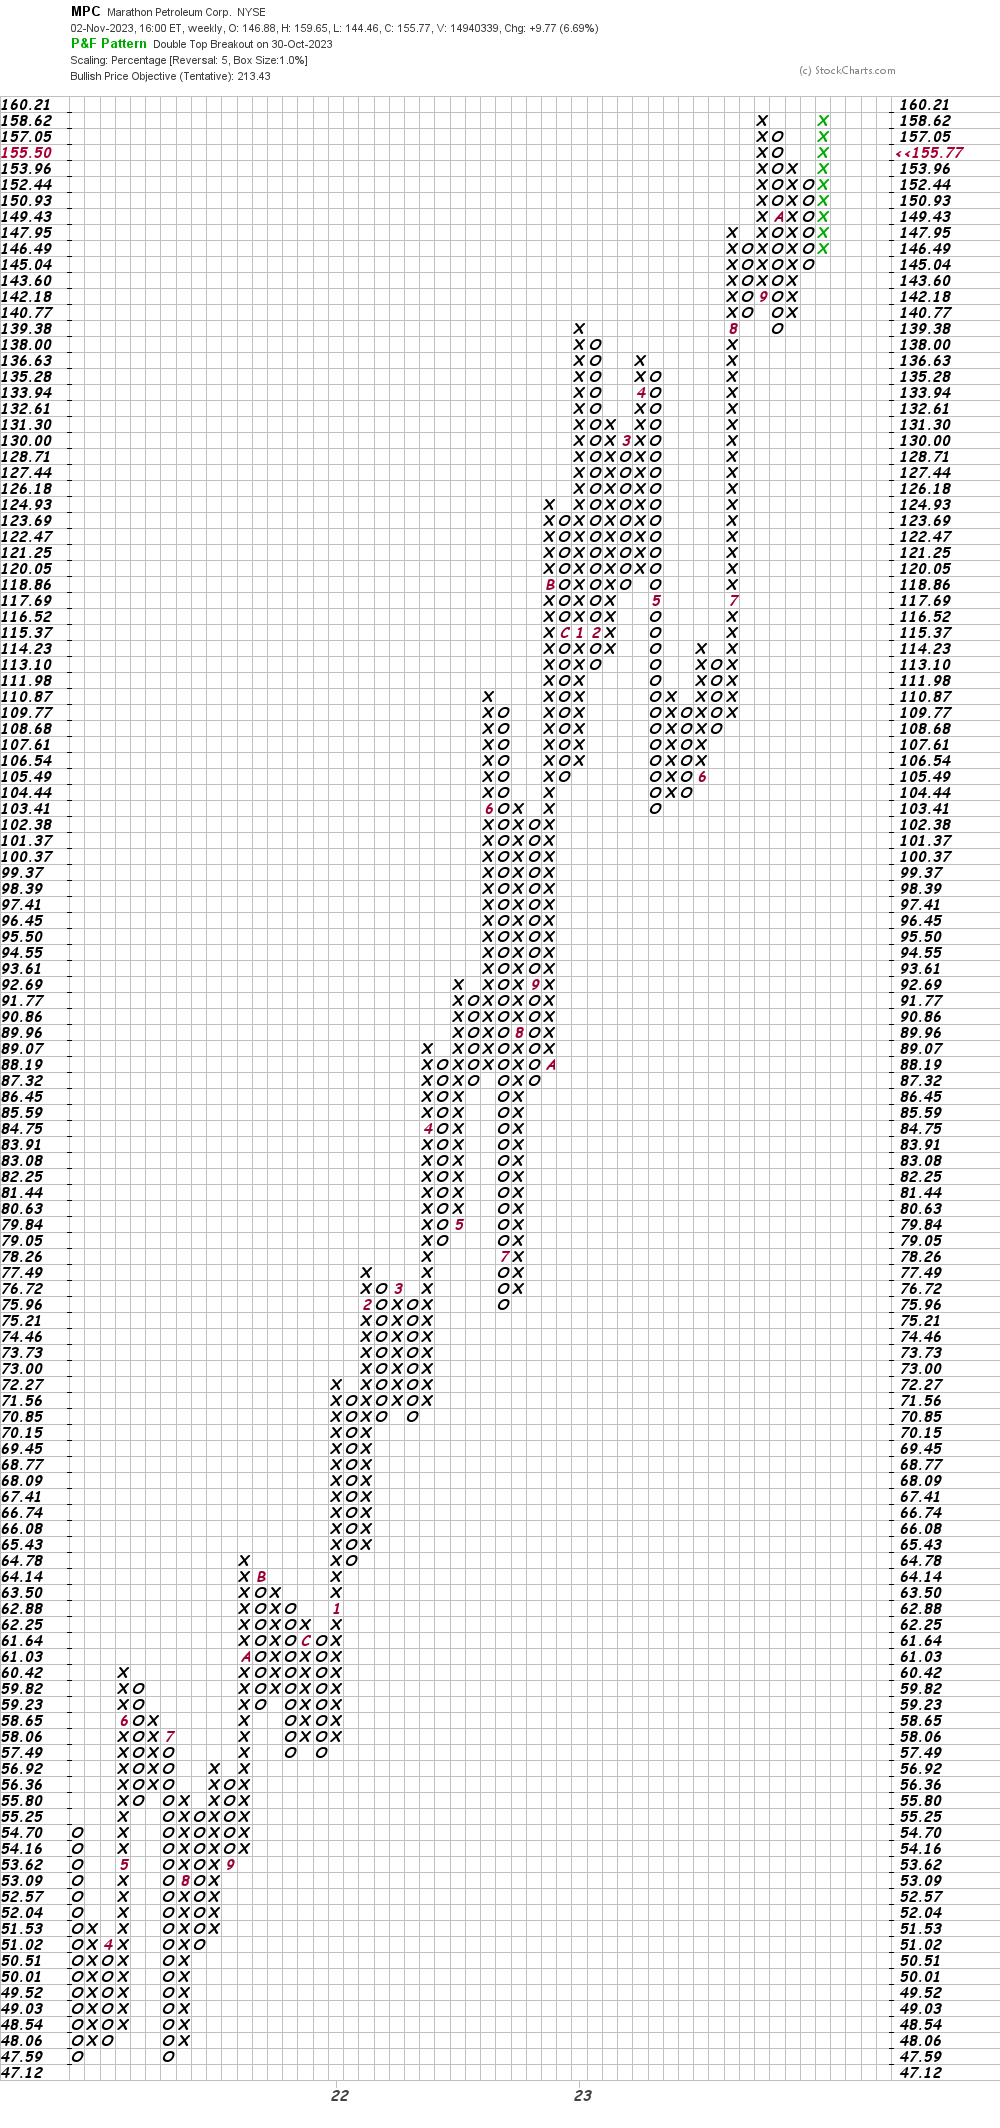
In this weekly Point and Figure chart of MPC, below, I used a five box reversal filter. Here the software projects a price target in the $213 area.
Bottom line strategy: Traders could go long MPC at current levels risking to $144. $186 and the round number of $200 are my price targets for now.
Employees of TheStreet are prohibited from trading individual securities.