With Tandem Diabetes Care, Wait for a Correction
Traders could go long, but they need to be patient.
You've reached your free article limit
You've read 0 of 1 free Pro articles.
Tandem Diabetes Care TNDM develops medical technologies for the treatment of diabetes and specifically insulin infusion therapy. The stock price gapped higher Friday on the heels of an earnings and revenue beat reported last evening.
Let's check out the charts and indicators.
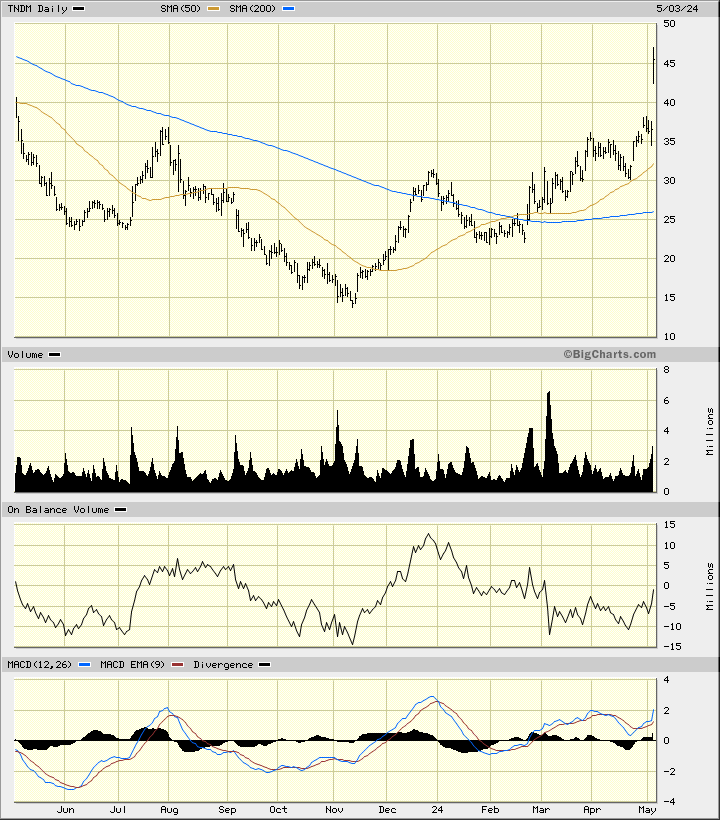
In this daily bar chart of TNDM, below, I can see how prices have rallied to the upside after making a base pattern. Prices are trading firmly above the rising 50-day moving average line and above the rising 200-day moving average line. The trading volume has increased in the past three months signaling more investor interest.
The On-Balance-Volume (OBV) line has moved up and down with the price action. The Moving Average Convergence Divergence (MACD) oscillator is in a bullish alignment above the zero line.
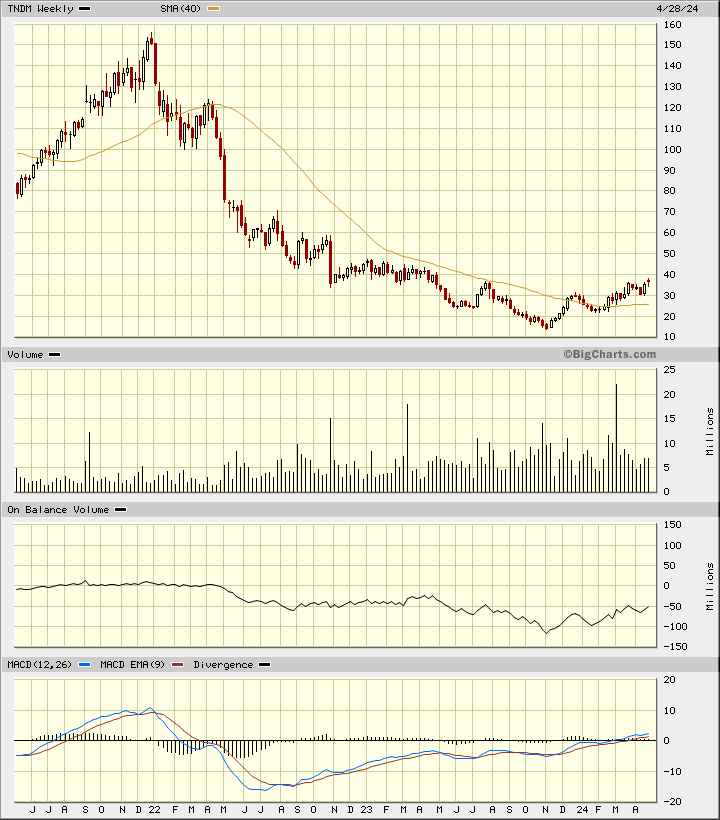
In this weekly Japanese candlestick chart of TNDM, below, I can see that prices made a long decline followed by a base pattern. TNDM is trading above the rising 40-week moving average line. The OBV line is moving higher since a low in November. The MACD oscillator is above the zero line.
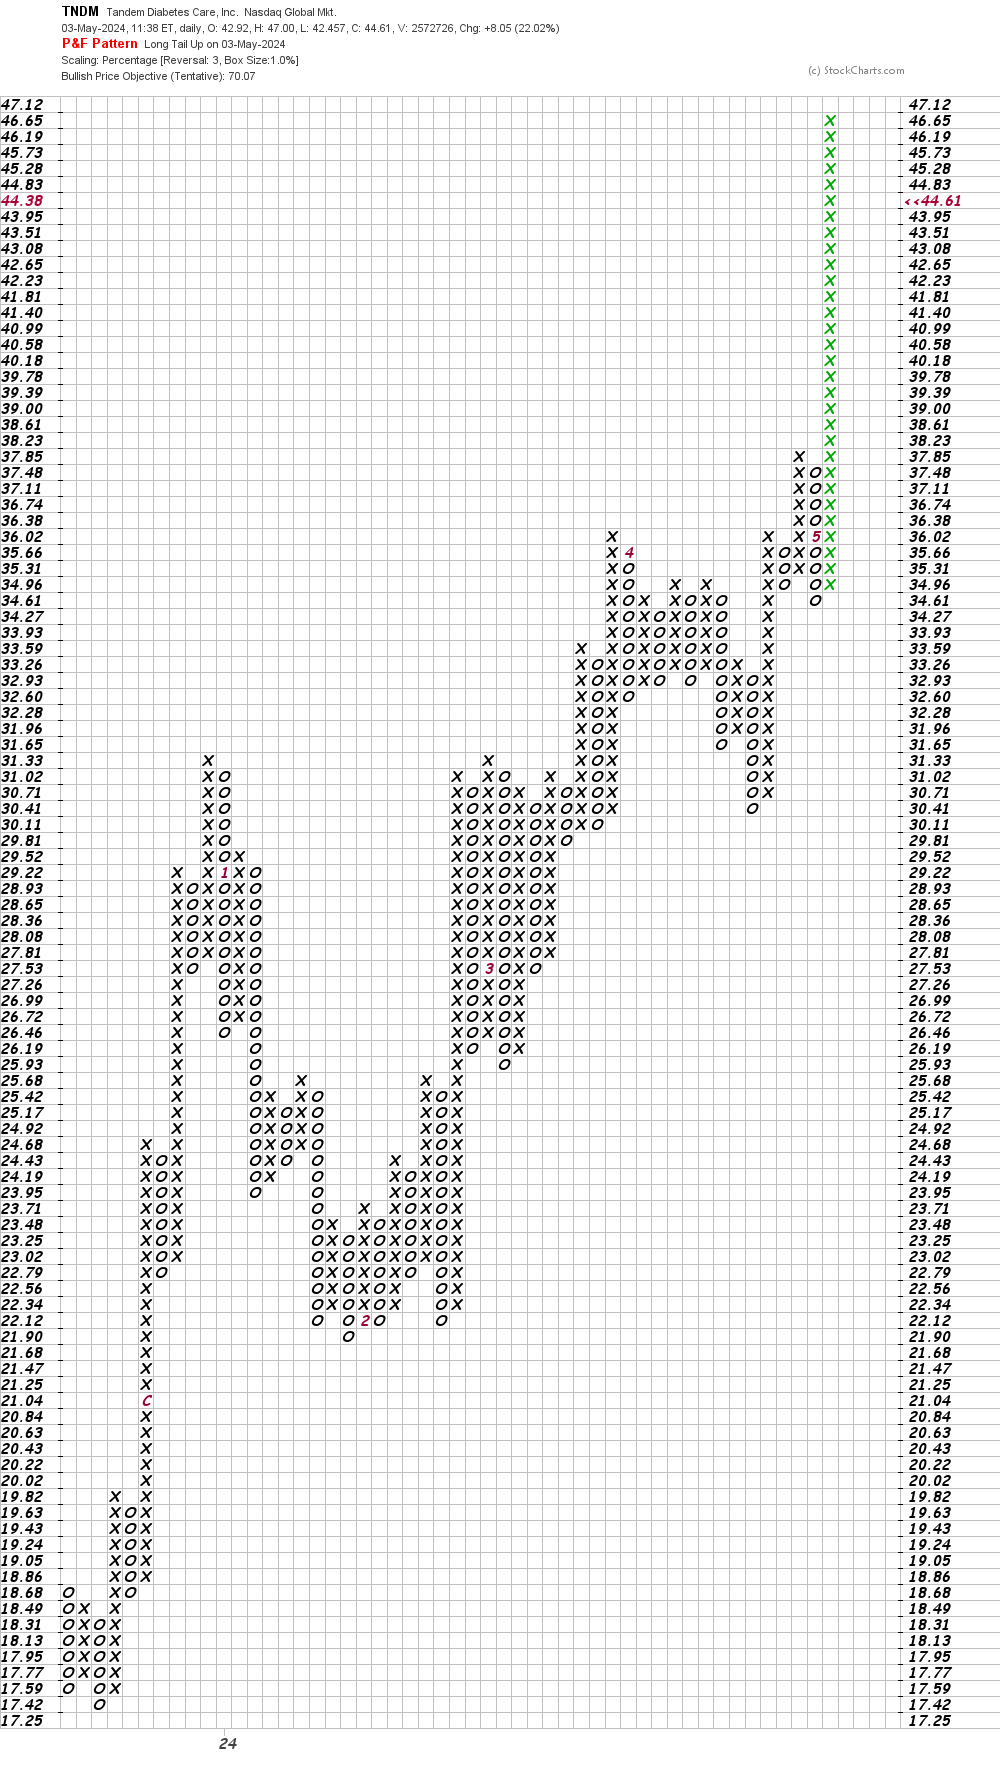
In this daily Point and Figure chart of TNDM, below, I can see an upside price target in the $70 area.
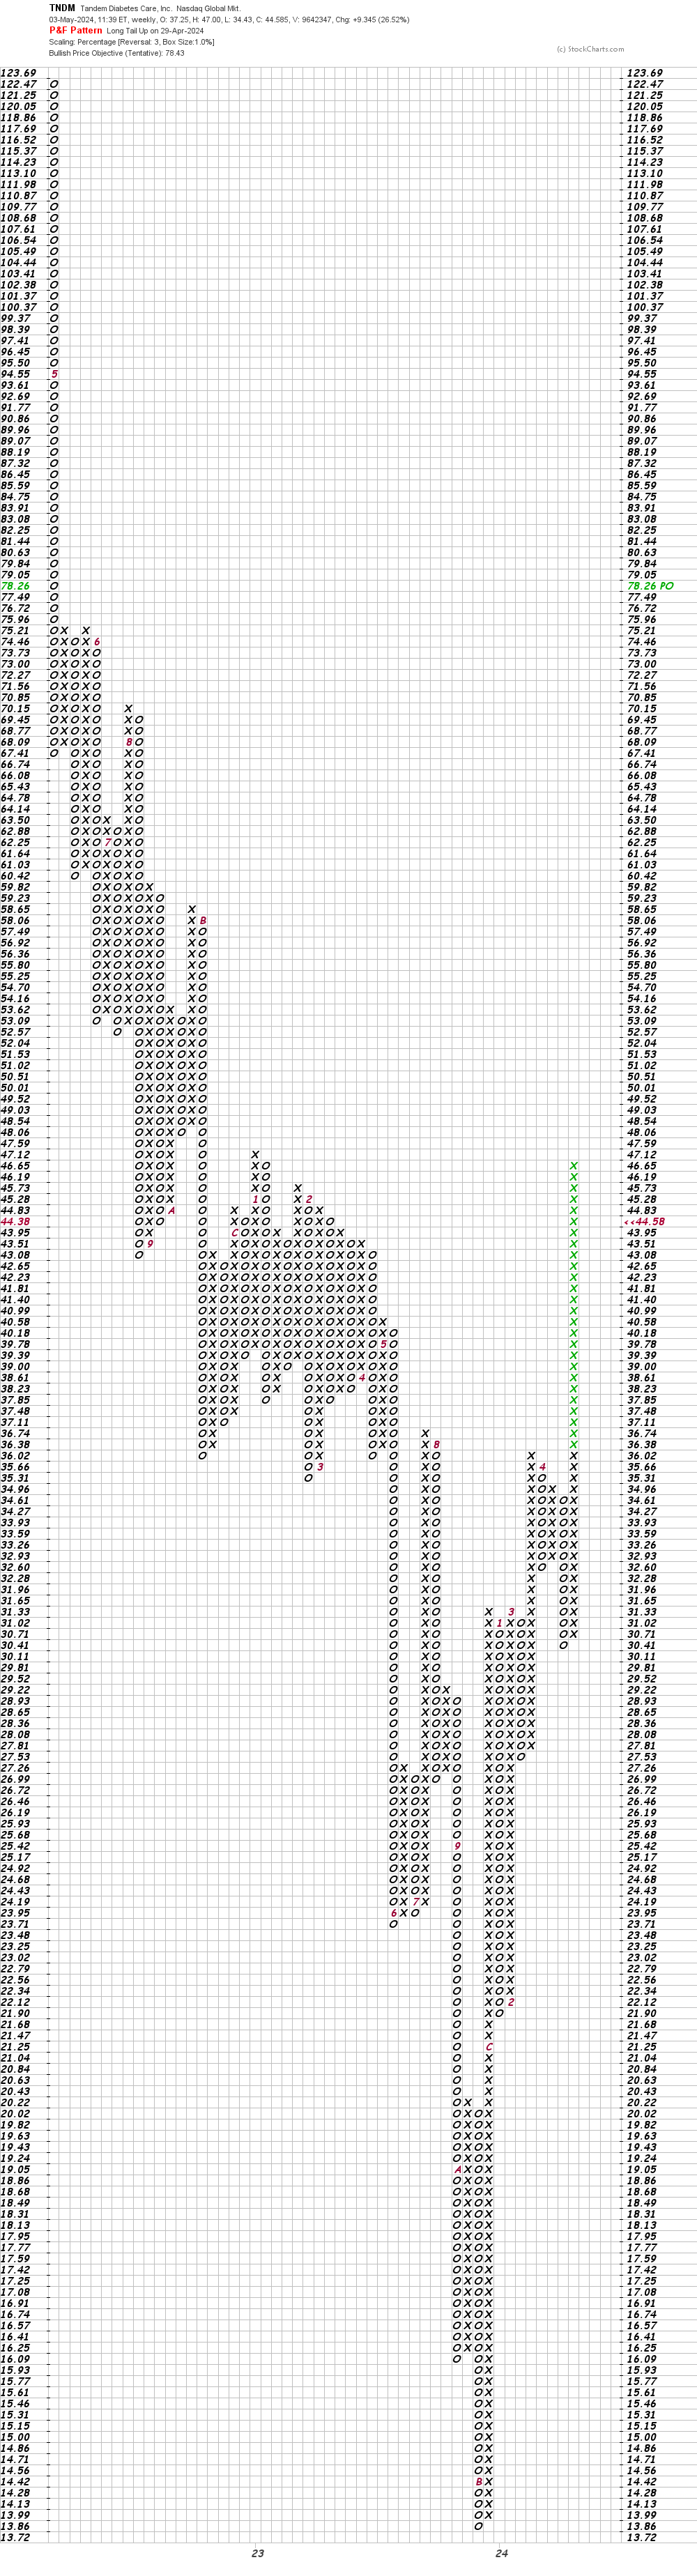
In this weekly Point and Figure chart of TNDM, below, I can see a price target in the $78 area.
View larger here.
Bottom line strategy: Traders could go long TNDM but they need to be patient and wait for a correction or dip towards $40 risking to $31. $70 and $78 are my price targets.
Employees of TheStreet are prohibited from trading individual securities.