Will This Be a December to Remember?
It's highly unusual for a market that's been up so much to tumble into year-end. So, let's take a look at the indicators. Plus, META, CTRA, PFE, PR, AMD, EWQ, TLT, EOG, and CCJ.
You've reached your free article limit
You've read 0 of 1 free Pro articles.
The Market
As we head into the end of the year, I will repeat again that it is highly unusual for a market that has been up so much this far to tumble into year-end. They tend to stay up, even if we get a pullback in early December (likely).
That doesn’t mean I have to like a market that shows sentiment that’s so over the top bullish. Oh yes, I know last week’s AAII readings showed more bears than bulls, but aside from that ridiculous survey, do you see that anywhere else?
The put/call ratios are falling off the bottom of their charts. The Citi Panic/Euphoria is literally off the top of the chart. The Bull/Bear spread for the Investors Intelligence is at 3.46 (every reading over 4.0 has brought us a correction). Even the NAAIM folks have increased their exposure to the highest in months.
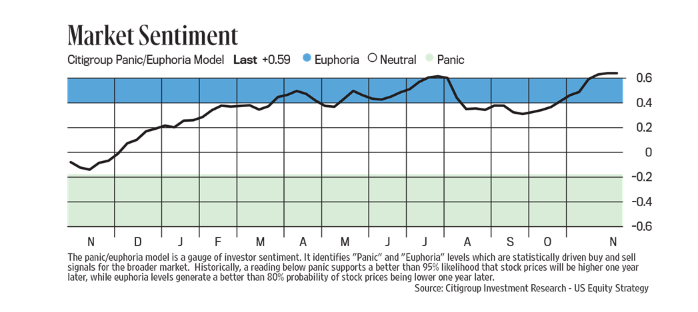
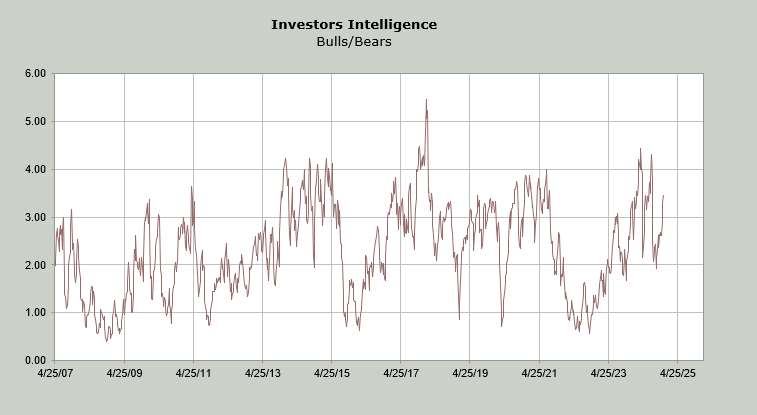
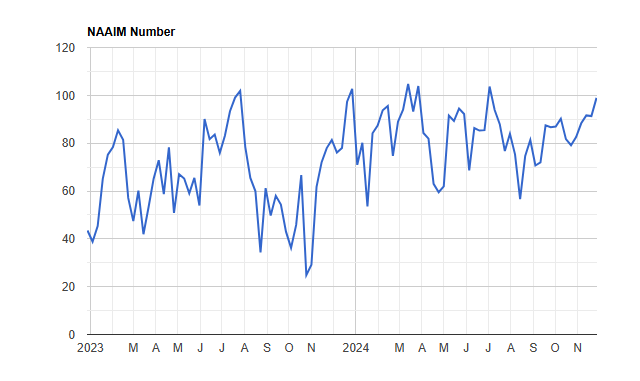
A week ago we discussed all those charts that were up at the top of their ranges. Last week did very little to change that. There was an awful lot of churning at those highs. What has been working is to find what is oversold and see if the boat has gotten too one-sided (negative) on that name/group enough for it to rally.
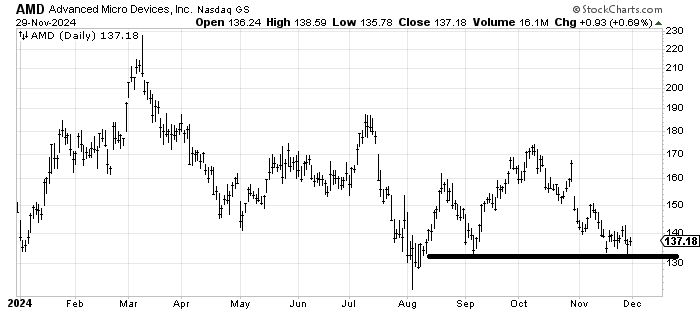
Last week, I highlighted the semis and specifically AMD AMD. Thus far, that has been a wrong move as AMD has continued to languish.
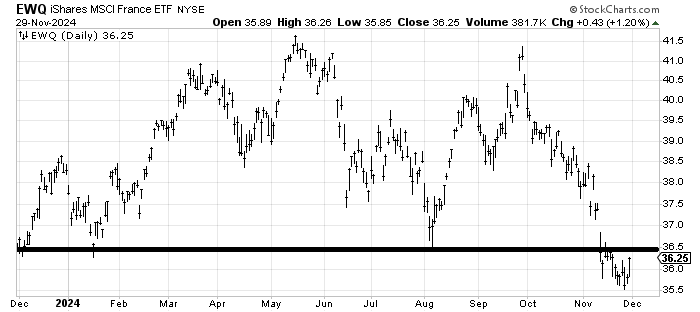
In another example of down and out, we have Europe. I have had several questions about Europe because if you look at the P/E of European stocks relative to the US, it looks cheap (or so I am told!). I can tell you that aside from a handful, no one likes Europe. It appears their economies are slowing and the charts of the various indexes have been nothing but down for two months now.
Yet I look at the chart of EWQ EWQ, an ETF to be long France, and I am immediately drawn to it. It broke an important support level and had no follow-through whatsoever. The big test will obviously be as it approaches 36 (will it be resistance or not?). If it can get through there maybe there are shorts to be run in.
Consider that much of the move in the European markets has also been related to the buck, which we discussed here in great detail a week ago (sentiment had gotten too one-sided there--to the bullish side). So if the buck keeps backing off and our bonds keep rallying (it’s all related), then there should be a trade to be had in these European markets.
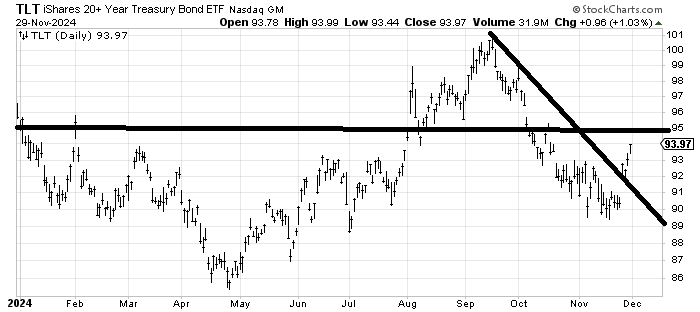
Speaking of the bonds, we finally got the rally last week. Of course, now that we got the rally, everyone seems so certain that they knew rates would back off (then why was bond sentiment so sour???). TLT is back at that 94 level that I had eyed as support on the trip down. Let’s call resistance now 94-95. I suspect it runs into some short-term trouble there. Chair Powell speaks this coming week, so it will probably be an excuse to see some profit-taking in TLT. On an intermediate-term basis, I do not think the rally is done yet.
New Ideas
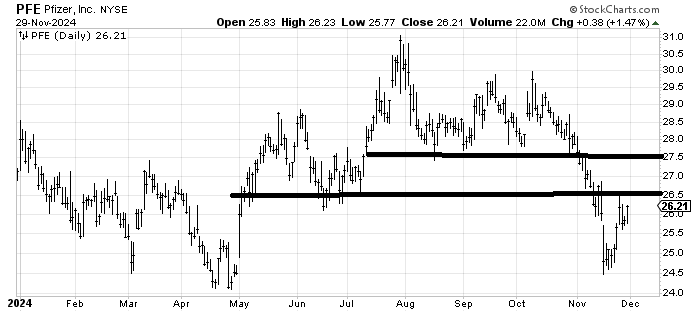
When Pfizer PFE gapped down a few weeks ago on that extremely high volume I said it was ripe for a trade. It took about a week, but it finally rallies. Now the question is: where is it going? I think it ought to get into that 26.50-27.50 range. It ought to try the top of the range because that volume was so high.
Today’s Indicator
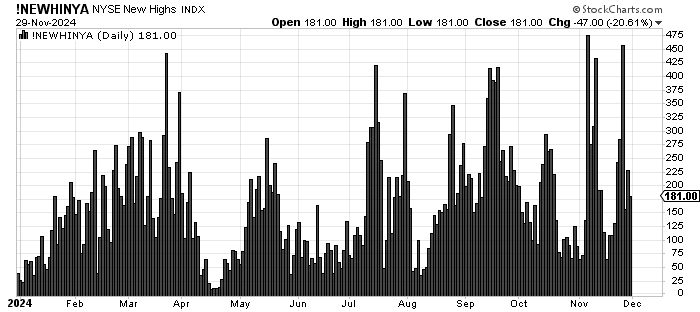
The number of stocks making new highs has still not surpassed the peak readings from a month ago.
Q&A/Reader’s Feedback
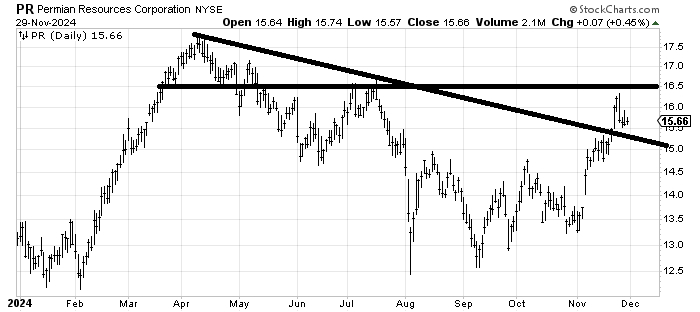
Permian Resources should find some support in this 15.15.50 area but it should take some time to eat through that resistance in the 16.50-17.50 area. For now maybe it’s in a trading range of 15-16.50.
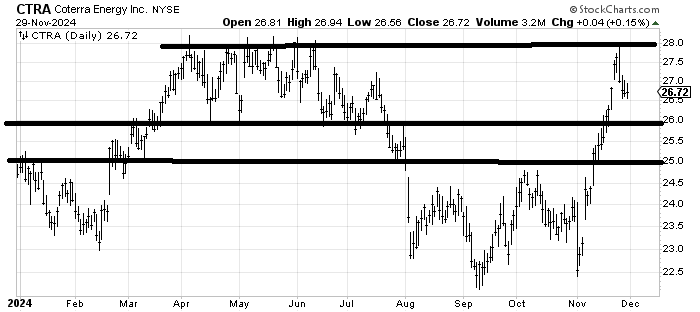
Coterra Energy CTRA should have some support back in the 25-26 area on this first pullback from resistance. I have a hard time chasing a stock that has run 20% in such a short time but I would expect a bounce from support.
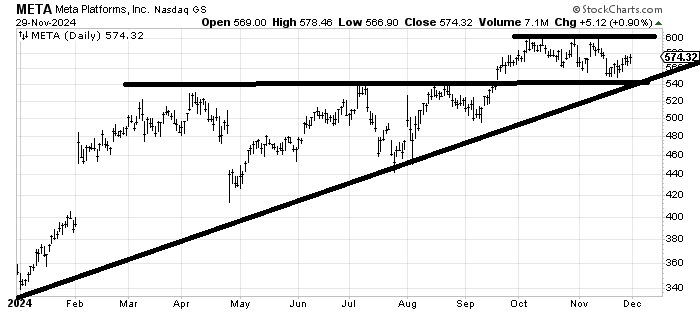
When I was asked about Meta META a few weeks ago, I said I thought it ought to bounce off that line around 540. It came close but never got to the line. I find myself pretty neutral on the stock. Sure, it hasn’t rallied to a new high in a few months but it hasn’t broken anything either. I would probably still buy it if came back to test support at that 540 area.
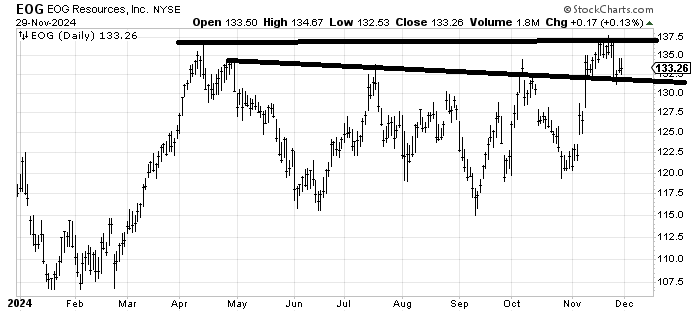
EOG Resources EOG has some support in this 130-132 area. That resistance at 137-138 is a problem though. I’d look for a bounce this week but I’m not sure it is going anywhere special.
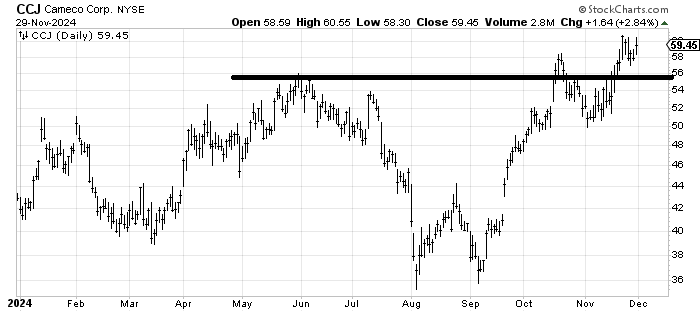
Cameco CCJ is not my kind of chart because it is up and has rallied already but that base measures to the mid 70s longer term. I would prefer it doesn’t break under 55-ish.