Who Cares if Tech Participates, Utilities Are the New AI Play
Folks have gone wild for the Utes, but a shakeout is needed now. Also, let's go bottom fishing with Fastenal, take a peek at the down-and-out JNJ, and examine the biotech ETF.
You've reached your free article limit
You've read 0 of 1 free Pro articles.
The Market
Okay we got the up day, now let’s see if the overbought condition causes a pullback.
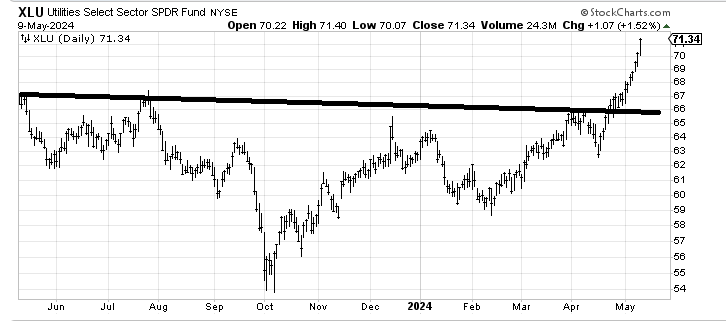
One thing is for sure, folks have gone wild for the Utes. There is a narrative around that they are the new AI play. Since I am terrible at narratives I will just point out that there is so much love for them and they are stretched. They really need a pullback.
One reason they need a pullback is that they have been up for so many days in a row. There is a statistic out there that when they get to nine or 10 straight green days it’s actually quite bearish for them, thus a pullback is needed so they don’t get there.
The chart of the Utilities Select Sector SPDR Fund XLU below measures to the upper $70s so I am still not bearish on them, but I would suggest taking something off the table here since a shakeout is needed.
As good as breadth has been the number of stocks making new highs has not expanded much this week. I think that is part of the overboughtness and part of the fact that so many stocks are in these wide trading ranges.
The NYSE did not increase the new highs from a few days ago and the Nasdaq only had a few more.
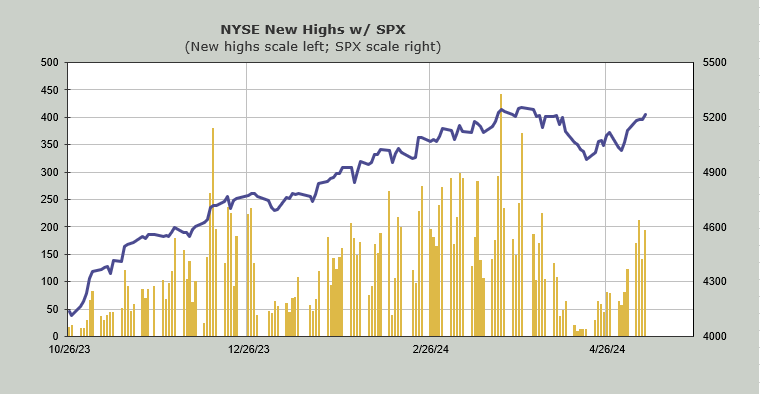
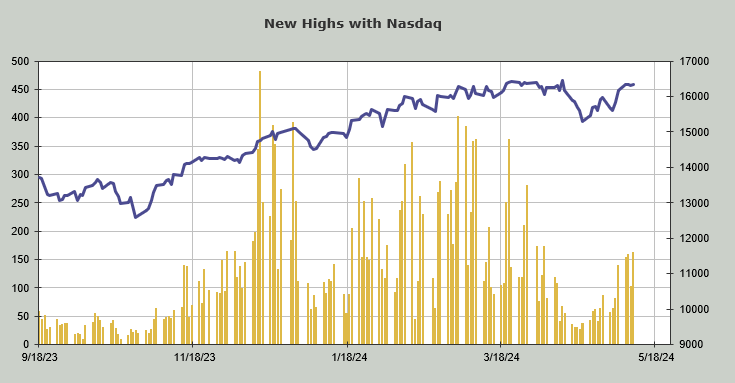
It is funny the way no one seems to care that tech barely participated Thursday. A month ago that would have been unthinkable.
New Ideas
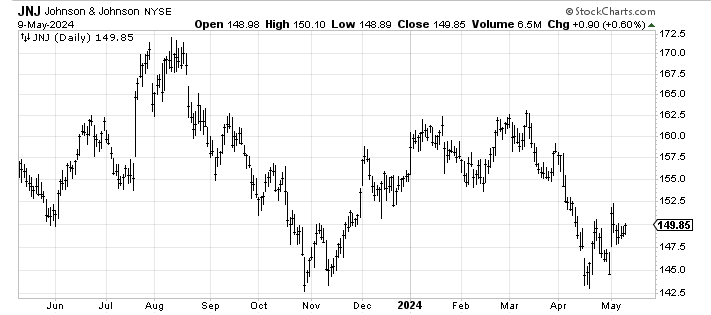
Because I am always drawn to down-and-out stocks once again I will highlight Johnson & Johnson JNJ. I’m still looking for a move up to $155-156.
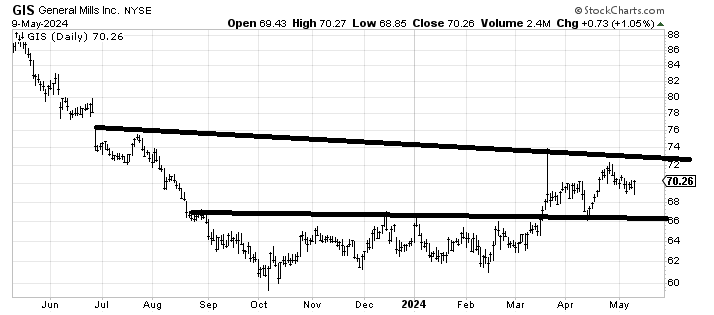
I have recommended General Mills GIS before but it has had a decent pullback and seems to be holding this support. Some day — some day!!! — it really ought to fill that gap around $78.
Today’s Indicator
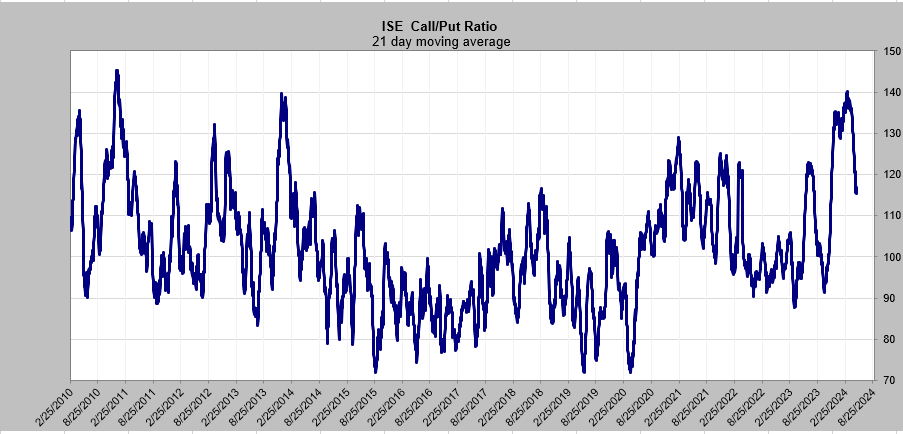
The ISE call/put ratio’s 21-day moving average continues to fall. I can’t say it’s bullish (under 1.00 would be bullish) but it is no longer bearish. I’d say it leans bullish now.
Q&A/Reader’s Feedback
Helene welcomes your questions about Top Stocks and her charting strategy and techniques. Please send an email directly to Helene with your questions. However, please remember that TheStreet.com Top Stocks is not intended to provide personalized investment advice. Email Helene here.
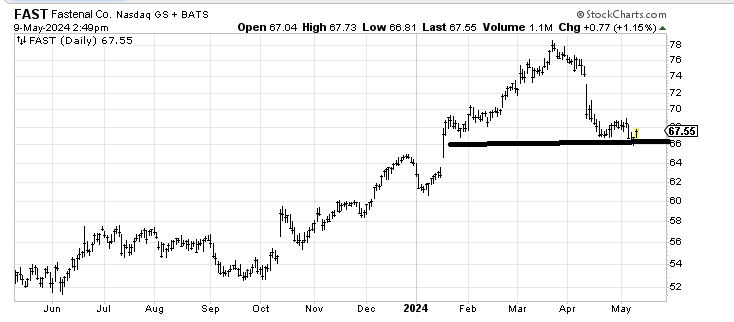
I look at a chart like Fastenal FAST and immediately I think how can this shape up to be a better chart. We have had some success lately bottom fishing these types of charts (Home Depot HD, Boeing BA, e.l.f. Beauty ELF, Costco COST, etc.). I suspect FAST will shape up too.
FAST probably needs a rally to say $68-69 and another little pullback before it has enough underneath to push it upward. So I would nibble in the mid-$60s (and if it got to the low $60s I’d be more aggressive) with the thought that it will take a while but it ought to rally.
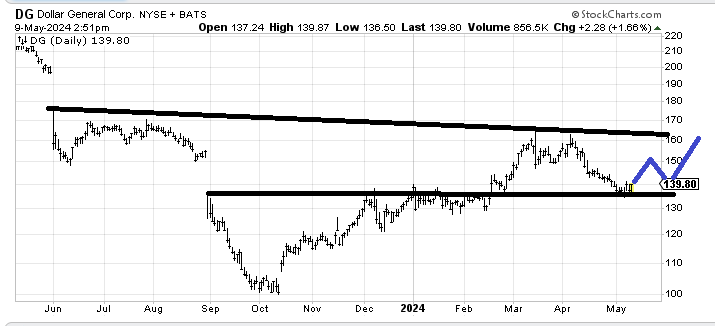
Dollar General DG is working on a base. The stock hasn’t gone anywhere in a year but since October it has higher lows, especially if it can hold over $130-135. I can see it mapping out as I have drawn in below (or something akin to that).
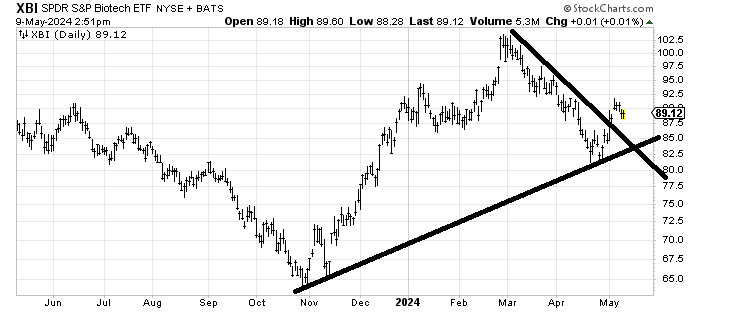
I struggle with the chart of the SPDR S&P Biotech ETF XBI. It had a great lift off the lows but then has struggled ever since. A whack to $83-85 would get me more interested. Otherwise it just feels like it is in the middle of nowhere here.