While Hurricane Helene Causes Major Damage, Stocks Have Yet to React
Between Mid-East tensions, incredible damage from Hurricane Helene, and the fact that the market remains overbought, it's surprising how little volatility we've seen. Among individual names, let's also look at QQQJ, SQ, XOM, UNG, MS, IGLB, AMLP, and HUM.
You've reached your free article limit
You've read 0 of 1 free Pro articles.
The Market
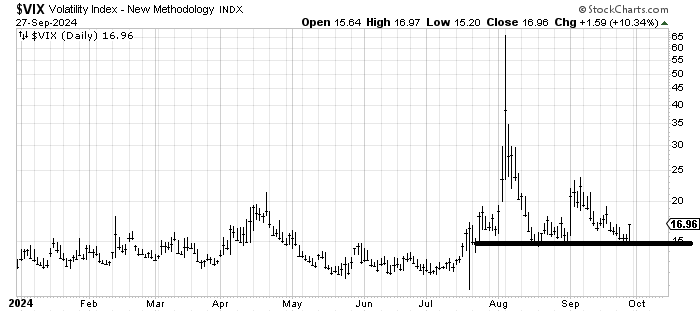
We did not get the bout of volatility I expected last week. I think it is still on the table, though. The VIX is not making lower lows, and it was up quite a bit on Friday.
Oh, sure, we can rationalize the VIX move on Friday due to Middle East tensions, but we’ve had tensions there every week for the last several weeks. I hate to rationalize an indicator, so I will not do so.
I especially don’t like to do it when we look back at the week and we see that if it wasn’t for the Chinese move and the one day for the semis, the week itself saw an awful lot of stocks churning. I do believe that is the overbought condition of the market at work.
Now we face the end of the quarter on Monday and the Employment report on Friday. I have no idea which way anyone is leaning for the Jobs report, but it is possible that Hurricane Helene is going to throw a monkey wrench into whatever data is reported.
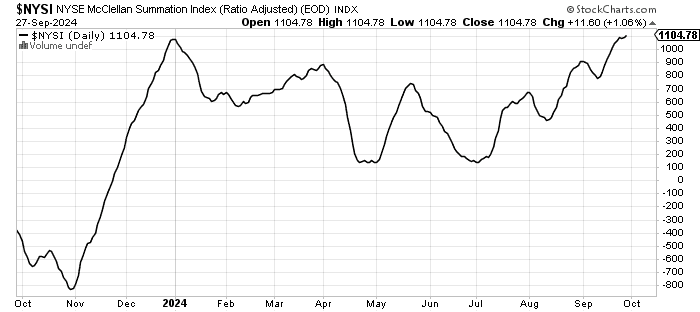
We did get the McClellan Summation Index to turn back up, but one minor down day, and it will be heading back down again. There is not much of a cushion for this indicator now.
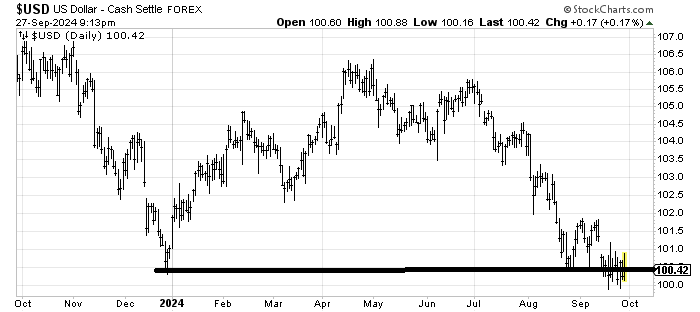
I want to address the Dollar Index. I have been of the mind that this 100 area would hold. So far, it has, but that’s all it has done is hold like it is on a cliff holding for dear life. I would not be surprised if there was a whoosh under 100 coming our way.
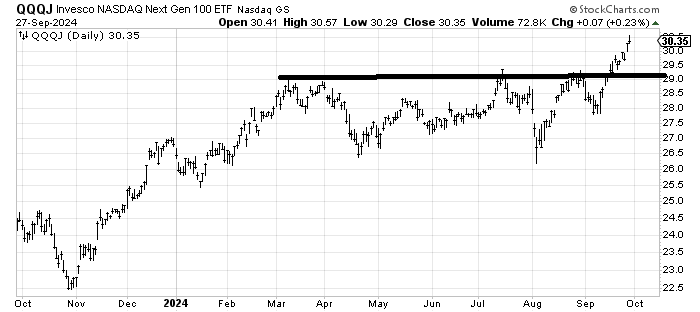
Finally, as you know, I have been a fan of QQQJ, an ETF to be long the ‘Next Gen’ QQQs. It has had a nice run and is a little overbought now, as you can imagine.
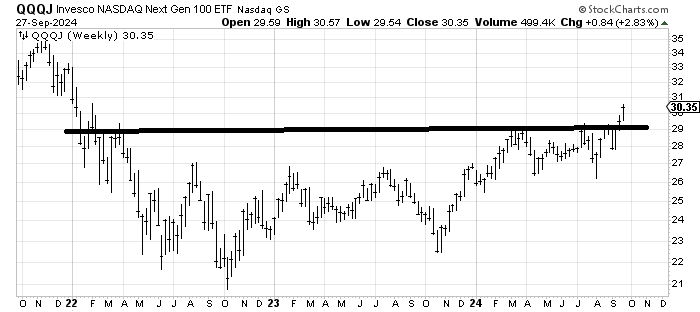
But in addition to the daily chart I want to show you the weekly chart (3 years). Long-term charts like this tend to have a lot of fits and starts, but I hope you can see the base. I am a buyer on a pullback to that 29 area.
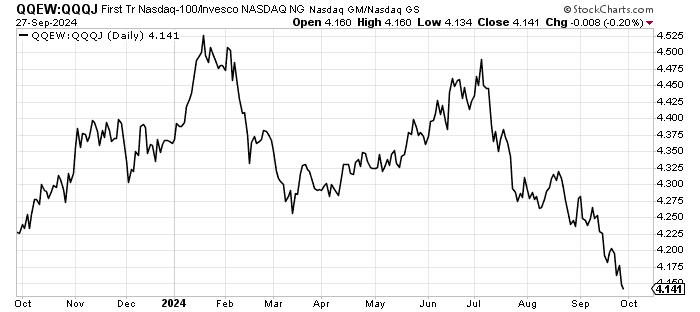
I don’t know what changed in July but you can see when we look at the equal weight QQQ relative to the QQQJ that was a trend change. Again, it looks a bit stretched here, but having been a laggard all year, folks have found their way to the small and mid-cap growth names.
New Ideas
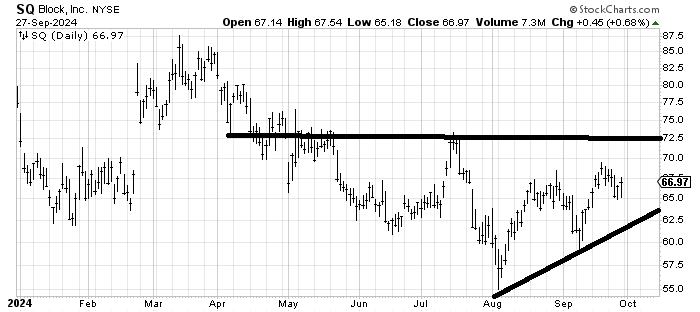
A while back, I was asked about Block SQ, and I was not impressed with the chart. However, it has been improving (last week’s pullback helped). I would like to see it stay over 65.
Today’s Indicator
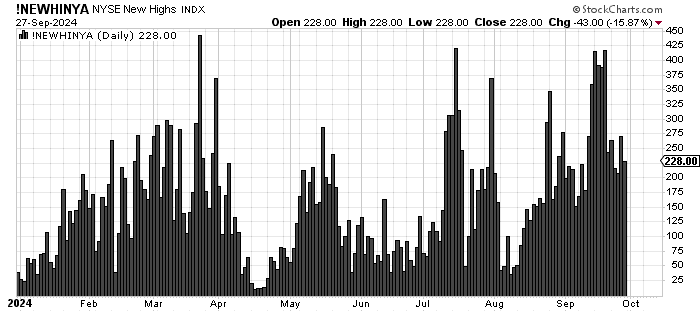
The new highs continue to contract.
Q&A/Reader’s Feedback
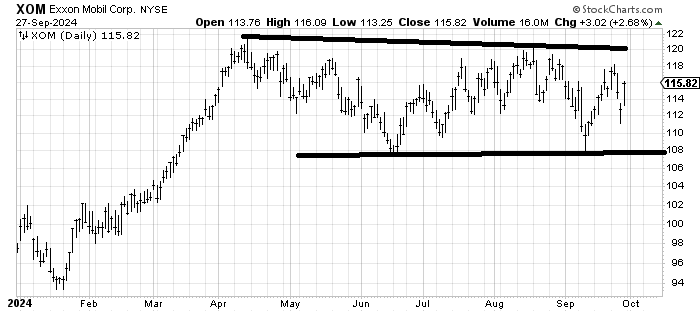
Exxon Mobil XOM is one of those stocks that has gone nowhere all year. I suppose for an energy stock to still be near its highs is a good thing these days. I have thought that a move over 120 would be terrific for this stock but I have thought that for 3-4 months now. I still think so.
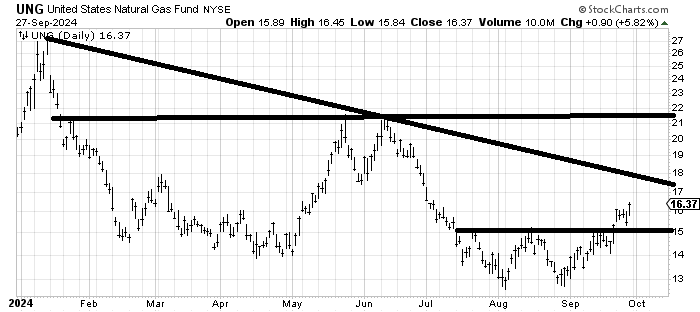
UNG UNG, an ETF to be long natural gas, is generally speaking a widow maker, so I tend to shy away from it unless it is extreme. This little base it has made has a measured target at/near 17. If it falls back under 15, be careful.
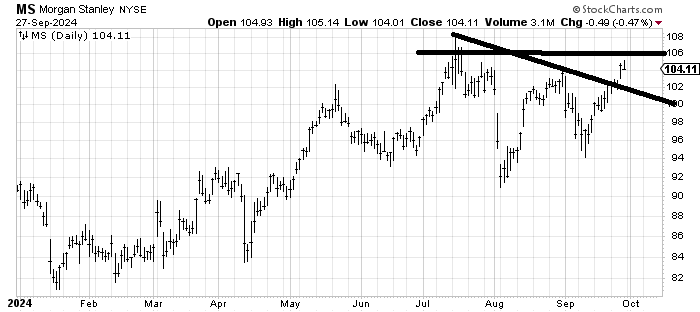
Morgan Stanley MS has a spike high from July at 108 and I am inclined to think that keeps a lid on the stock for the time being. I might take another look at it on a retest of that downtrend line around 100-101.
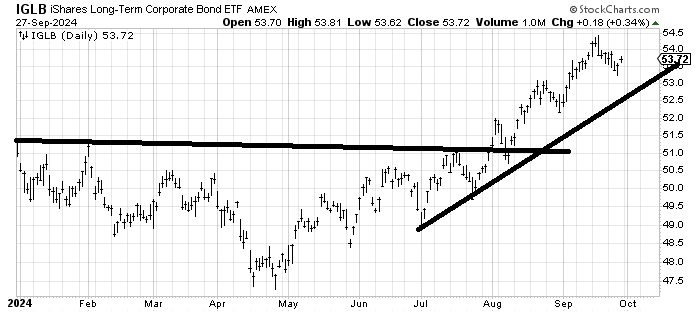
The iShares Long-Term Corporate Bond ETF IGLB has been in a nice uptrend and as long as it stays over that line (currently 52.50) it is. But that base measured to 54.50 so I would say the best it can do now is digest the move. I’d call it a hold.
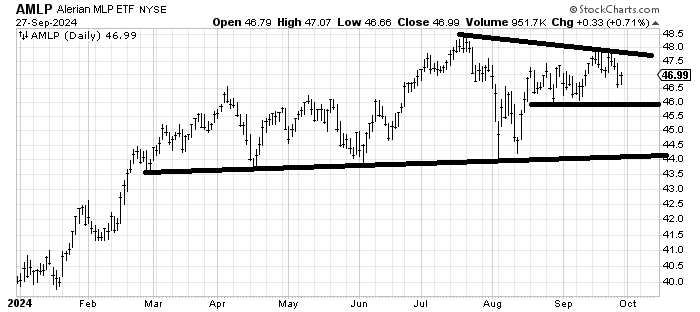
As a pure chart, I don’t love the Alerian MLP ETF AMLP, but I can see the attraction with that big yield. So let’s just say that as long as it stays over 46, it’s okay.
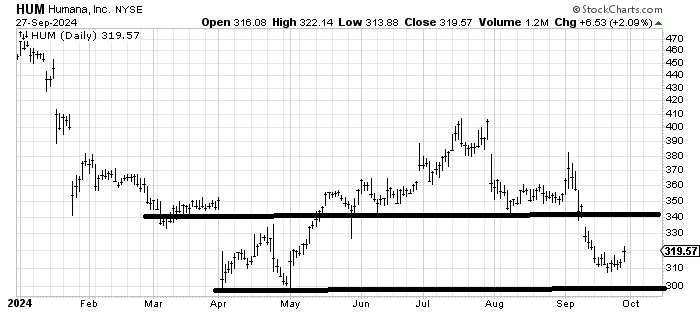
Humana HUM is my kind of chart: down and out. I would start by thinking that gap at 340 resistance is doable.