Which Magnificent Seven Stock Has the Best Chart?
Technicians have differing opinions, but this is my choice for the best potential with the least amount of risk.
You've reached your free article limit
You've read 0 of 1 free Pro articles.
It is no secret that the Magnificent Seven stocks have been the main driving force behind the strength in the indexes this year. While many market strategists believe that those ‘quality’ names will continue to outperform in the second half of the year, which ones are the best bets?
So far in 2024, this is how the Magnificent Seven names have performed:
- Nvidia NVDA: +155%
- Meta Platforms META: +40%
- Alphabet GOOGL: +29%
- Amazon AMZN: +24%
- Microsoft MSFT: +20%
- Apple AAPL: +8%
- Tesla TSLA: -26%
There is a wide variation in valuation, and trying to gauge which stocks will perform best based on that metric is nearly impossible. For example, Apple recently jumped more than 25% following its most recent earnings report, but during the same time, its EPS estimates have actually decreased. It moved because its AI story was finally embraced by the market and viewed as giving it a competitive advantage even if it didn’t produce an immediate increase in profitability.
Both Apple and Nvidia are now correcting after a big run, but neither has very good support so far. That can change quickly, but I don’t view them as good entry points right now based on the current chart.
Microsoft also had a V-shaped move after a dip at the end of May and may need more time to digest its gains and consolidate them a bit before their next report. It has good relative strength but has more risk of a correction
Tesla has been the laggard and now has quite a bit of technical overhead. It is off its April lows but has not generated momentum for more than two months. There is nothing very compelling about the chart.
Meta has good relative strength and recovered very nicely from a drop in April. It is consolidating around the $500 level and may be a good setup in front of its next earnings report. Meta has the biggest potential for an earnings surprise in either direction.
Amazon and Google have somewhat similar charts as they test recent highs and build on a high-level basis. Google tried to break out last week but fizzled out and needs to regroup for another try. Many analysts believe that Google has the most attractive valuation.
The chart I like best is Amazon. Amazon stock has tested the $190 level several times and has been turned back but keeps regrouping and trying again. The more a stock tests an overhead resistance level, the more likely it will eventually fail.
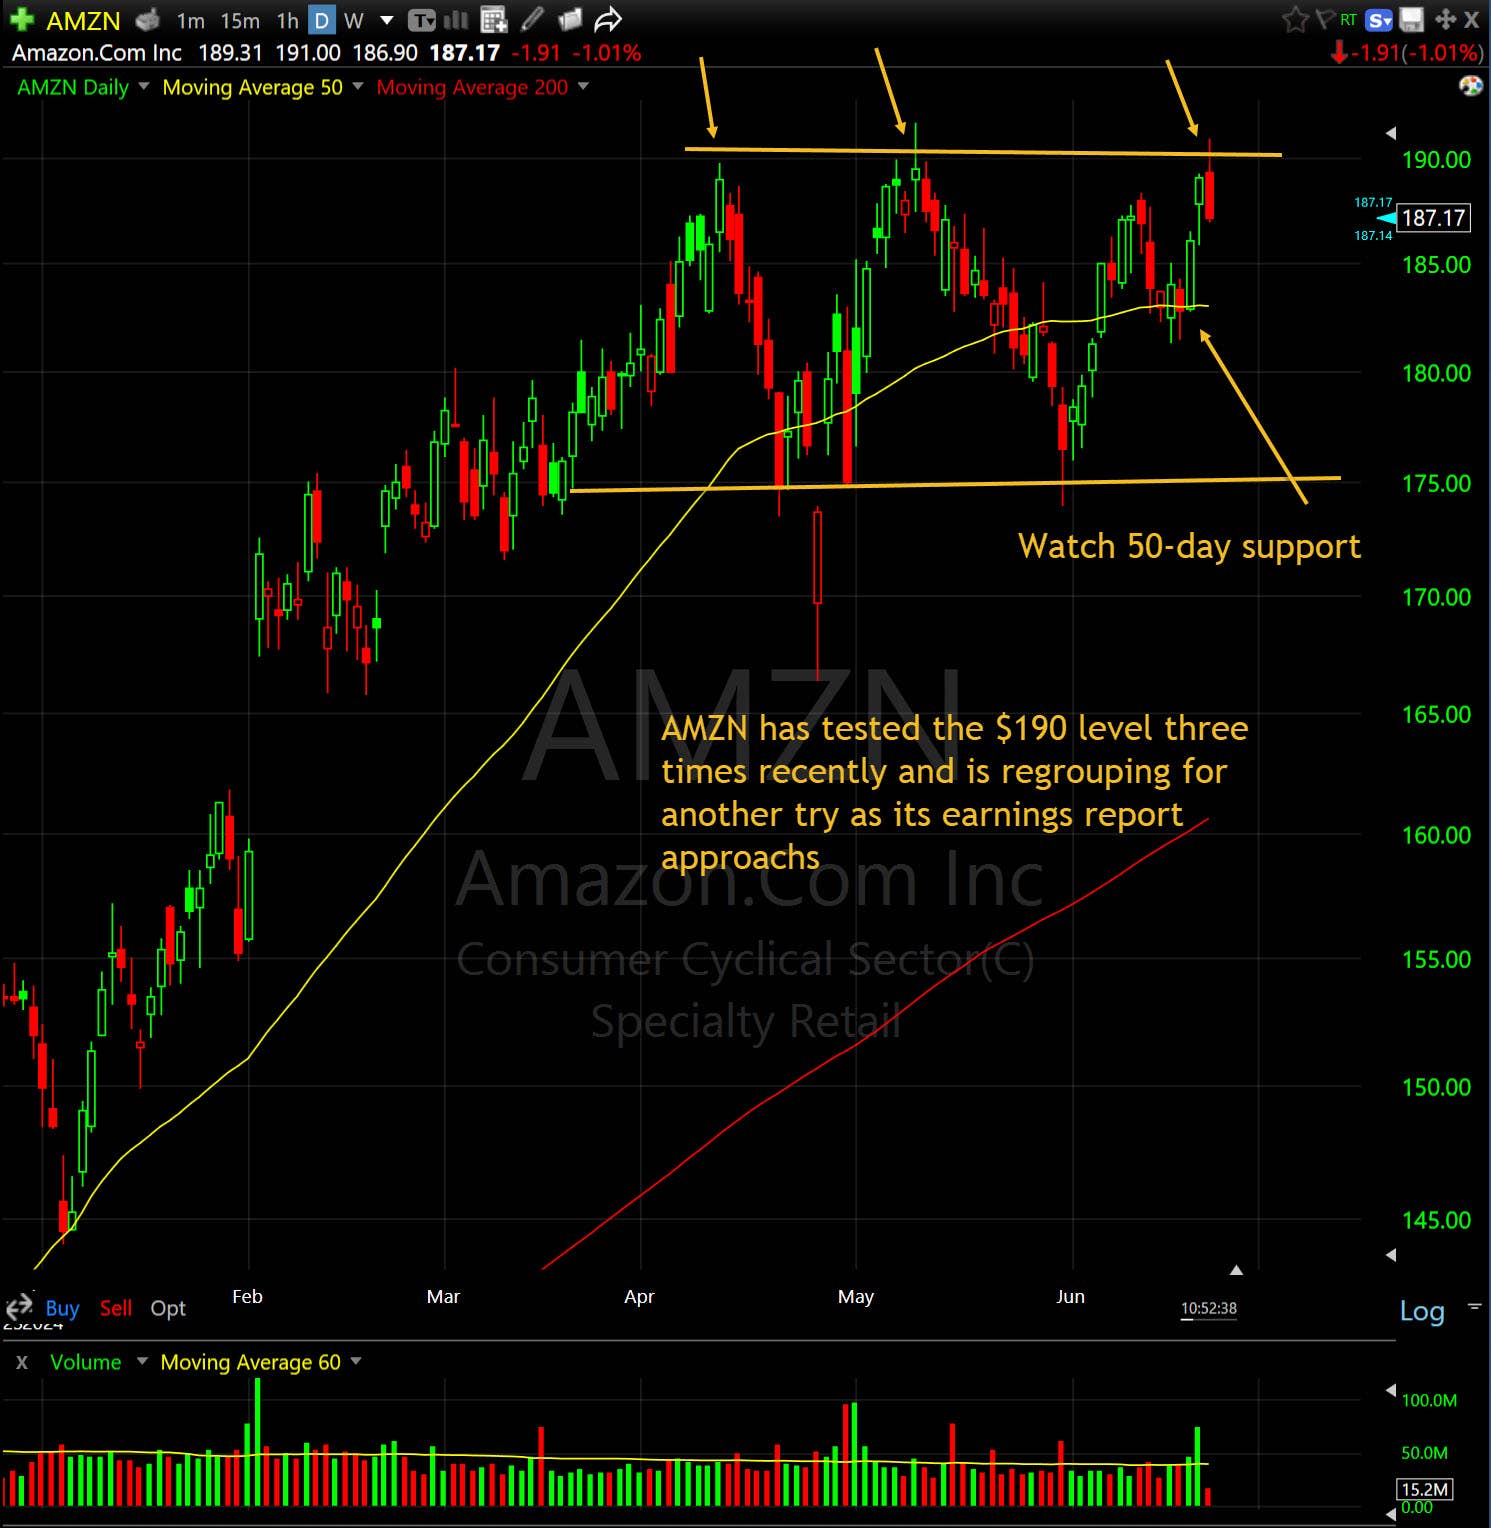
Chart reading is not purely objective, so technicians are going to disagree about what chart looks best. However, for my money, Amazon offers the best potential with the least amount of risk as it stands today.
More Trading Basics
- The Most Important Thing I've Learned in 25 Years of Trading
- Day Trading Is Very Difficult: Here Are 6 Tips for Long-Term Success
- Most Day Traders Fail. Here’s Why and What to Do About It
At the time of publication, Rev Shark was long AMZN.