Where's the Bearishness as the Market Gets Ready for Friday's Big Test?
As we mill around and not move, the bearish chatter is absent in the data. Friday could change that. Also, this chart's for you as we look at Anheuser-Busch, Las Vegas Sands and more.
You've reached your free article limit
You've read 0 of 1 free Pro articles.
The Market
I would prefer the market do more than just mill around at Tuesday’s lows but thus far the market prefers milling around to moving.
That means Thursday was more of the same. The indexes were lower (well, the Nasdaq rallied) and breadth was modest on the downside. Net volume was essentially flat. The new low,s on the NYSE increased but the Nasdaq’s contracted.
In the end there was very little change to any of the intermediate-term indicators.
I do think, though, that the chatter is becoming more bearish, although we’re not seeing it in the data. Not yet. The American Association of Individual Investors (AAII) bulls backed off a bit but so did the bears. Everyone seems to have flocked to the neutral camp. Even the folks at the National Association of Active Investment Managers (NAAIM) lowered their exposure, but not to any great extent as they went from the mid-80s to 71.
The put/call ratio spent most of the day in the 60s, which would be extreme in a solidly green market so it is eye-opening in a market that is down. In the end the puts started to rise late in the day and this metric ended the day with a more normalized reading of 0.85.
I say more normalized but really, where is the bearishness? Shouldn’t we have a reading over 1.0 already? I suppose if Friday’s employment number is bad news then maybe folks will finally start acting on the bearish chatter I’m hearing.
The big test Friday if the market takes the Employment number bearishly is if we can fill that gap around 5455 on the S&P 500. And we are now at three straight down days. We haven’t seen four down days for the S&P since April. A good number will keep that pattern alive but will also not get a gap fill and will not bring us any fear.
New Ideas
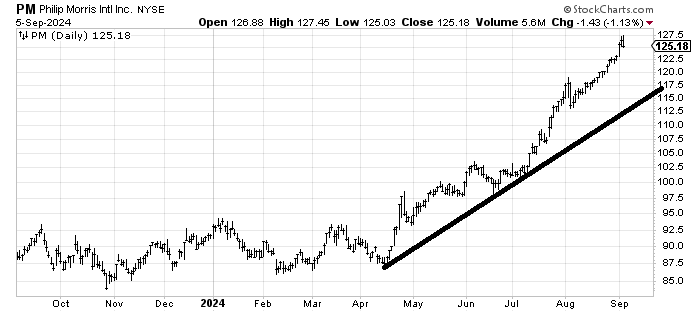
Philip Morris PM hasn’t done anything wrong yet but the stock is way over extended and so far from support I’d look to take some profits and expect a pullback.
Today’s Indicator
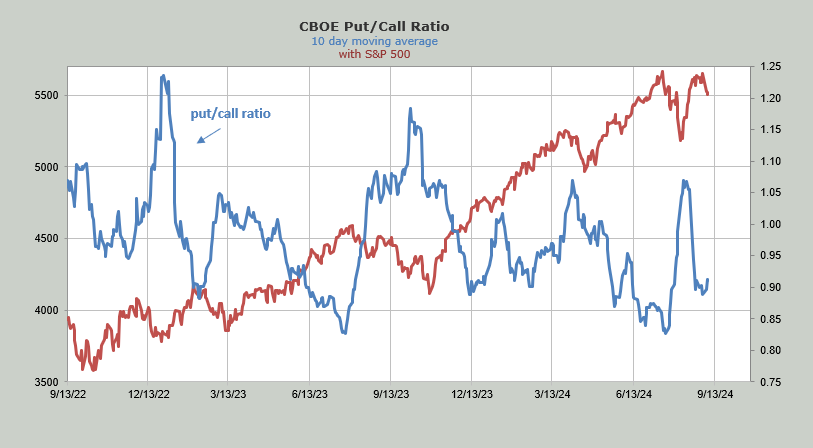
The 10-day moving average of the put/call ratio is heading up, which usually means the market is still complacent.
Q&A/Reader’s Feedback
Helene welcomes your questions about Top Stocks and her charting strategy and techniques. Please send an email directly to Helene with your questions. However, please remember that TheStreet.com Top Stocks is not intended to provide personalized investment advice. Email Helene here.
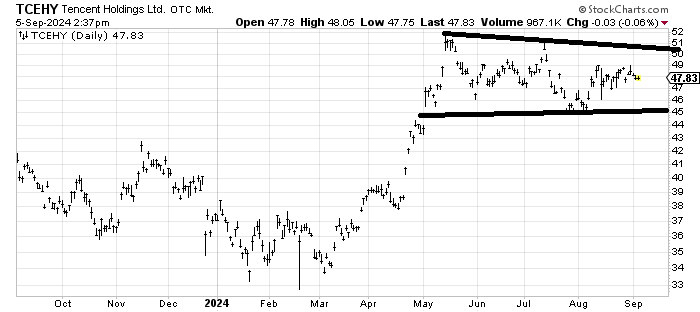
Tencent TCEHY met the upside measured target when it hit $52 in May. It has been going sideways since (well it has corrected 10%). I don’t have a strong view in the near term because it is sitting right in the middle of the range right now but if it can get over $49 without taking a trip to $45 first then I would think it can breakout over that $52 high from May.
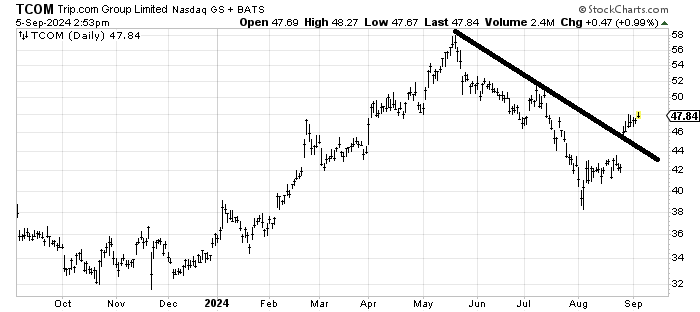
Since we’re looking at a Chinese stock, let‘s look at Trip.com TCOM as well. It sort of led the Chinese stocks to the downside this summer but it has been strong since the August low, crossing over the downtrend line. It is into resistance up here. If the stock pulled back toward $44 I’d be a buyer with a stop under $42.
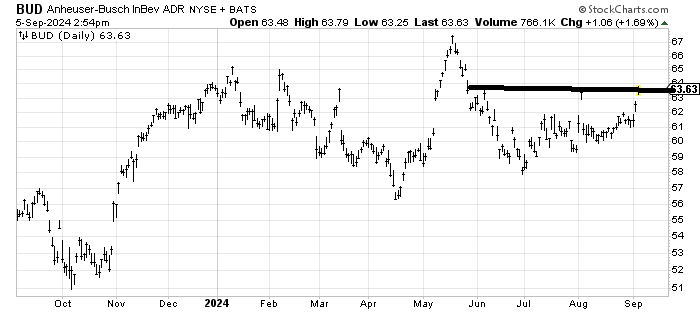
I cannot chase Anheuser-Busch InBev BUD, but it is a good chart. If it can get over $64 it ought to make a run at that May high. If it stops here I’d be very cautious.
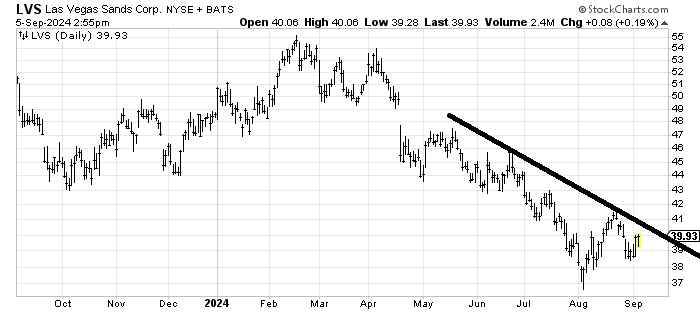
I had not looked at Las Vegas Sands LVS in a long time and therefore had not realized how bad it has been in 2024. I would say it’s trying to bottom. I would love to see it get back down to the mid-$30s (there is a measured target around $34-36) for a proper retest. But it is now on my radar.