A Full Rundown of the Indicators
Let's take a look at the short and intermediate-term indicators.
You've reached your free article limit
You've read 0 of 1 free Pro articles.
I have been asked to do a full rundown of the short and intermediate-term indicators.
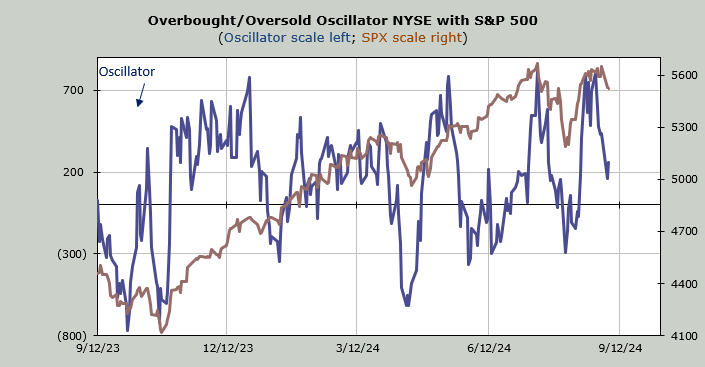
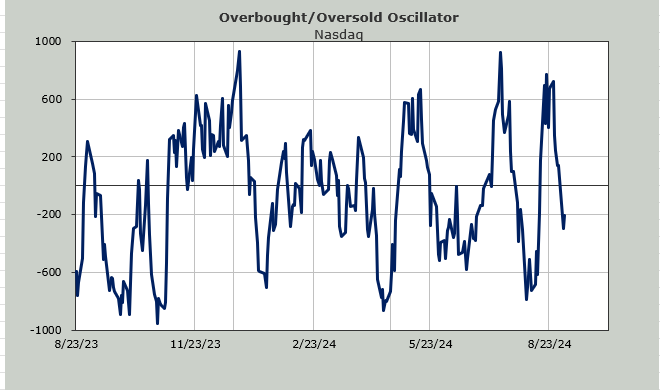
We’ll start with the Oscillators. Nasdaq is a little bit oversold. The NYSE is not. Three of the next four trading days will see positive numbers drop off the NYSE. Should we replace them with negative numbers we’ll get to an oversold reading quicker but right now I do not see any long string of negative numbers that we’re set to drop.
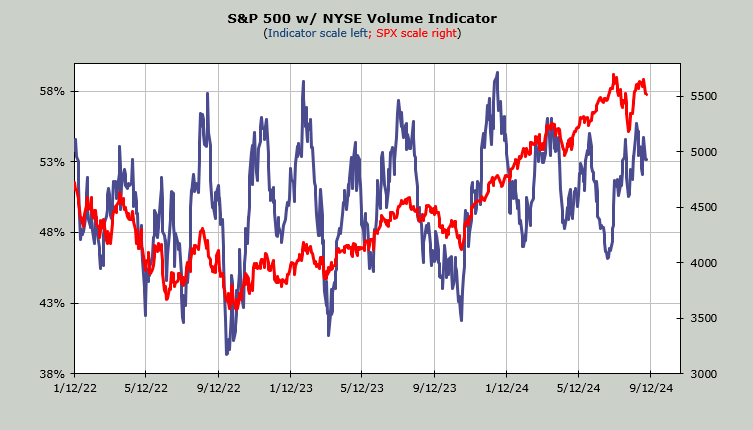
The 30-day moving average of the advance/decline line (shown here yesterday) is still overbought. The Volume Indicator resides at 52% which also is overbought. The mid 40s gets this indicator to oversold.
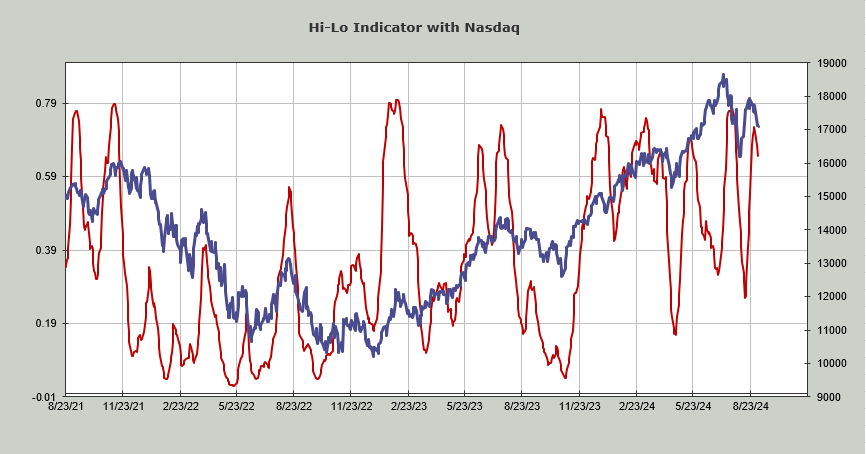
While the number of stocks making new lows did not expand much at all on Wednesday (that’s a plus) the Hi-Lo Indicator is just now rolling over and not even close to an oversold condition.
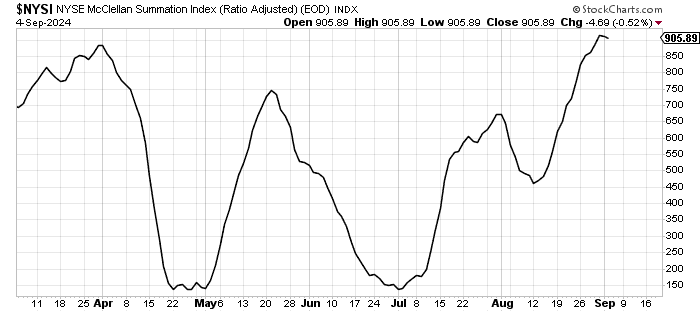
The McClellan Summation Index has actually held up rather well (breadth was flat on Wednesday). It is inching lower but it only requires a net differential of -700 advancers minus decliners on the NYSE to halt the decline.
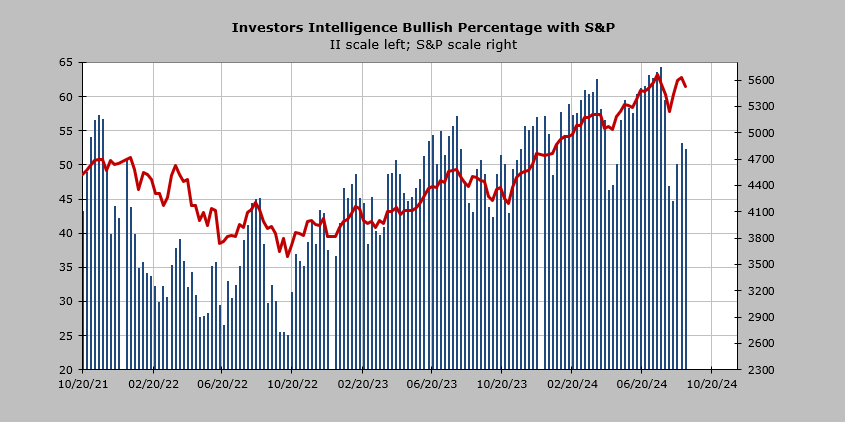
Then there is sentiment. The Investors Intelligence bulls are 52%. They do not take this past Tuesday into account but at over 50% it’s still too high. We will see the American Association of Individual Investors (AAII) out on Thursday morning and while they were over 50% last week I would expect to see that drop off when they are released this week. Remember, they jump around like day traders.
The NAAIM exposure number was still 81 last week. I expect that might fall this week as well, but it is nowhere near a level that screams bearishness. Recall in early August the Investors Intelligence bulls were in the 40s and I noted that a drop of 9 points had led to short-term rallies. NAAIM got down just under 60 in early August.
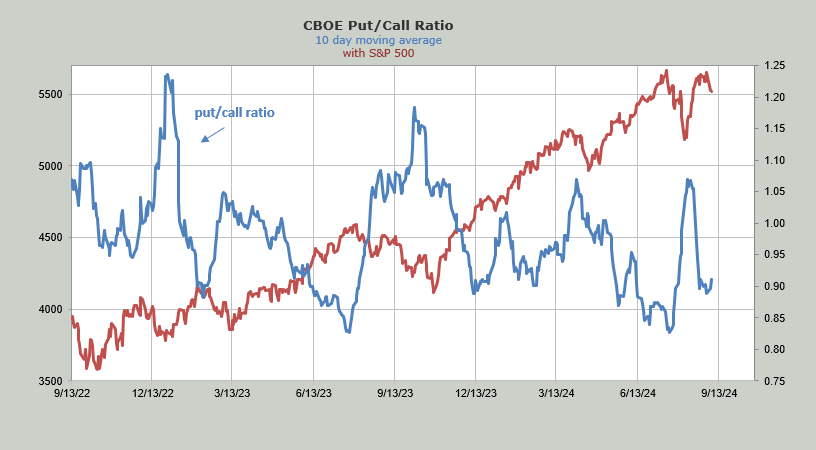
Wednesday the put/call ratio finally pushed up a bit, to .98. So folks finally decided to do some put buying. In early August that ratio got well over 1.0 several days in a row. If we look at the ten-day moving average we can see it is just now hooking back up and still resides at .90. Generally speaking a reading over 1.0 means some fear has crept in.
That’s where some of the indicators stand. I cannot point to any and say that it looks extreme. Will we get there? We always seem to get there. I do think we can rally for a day or two but those indicators need to move for me to think we can get more than that.
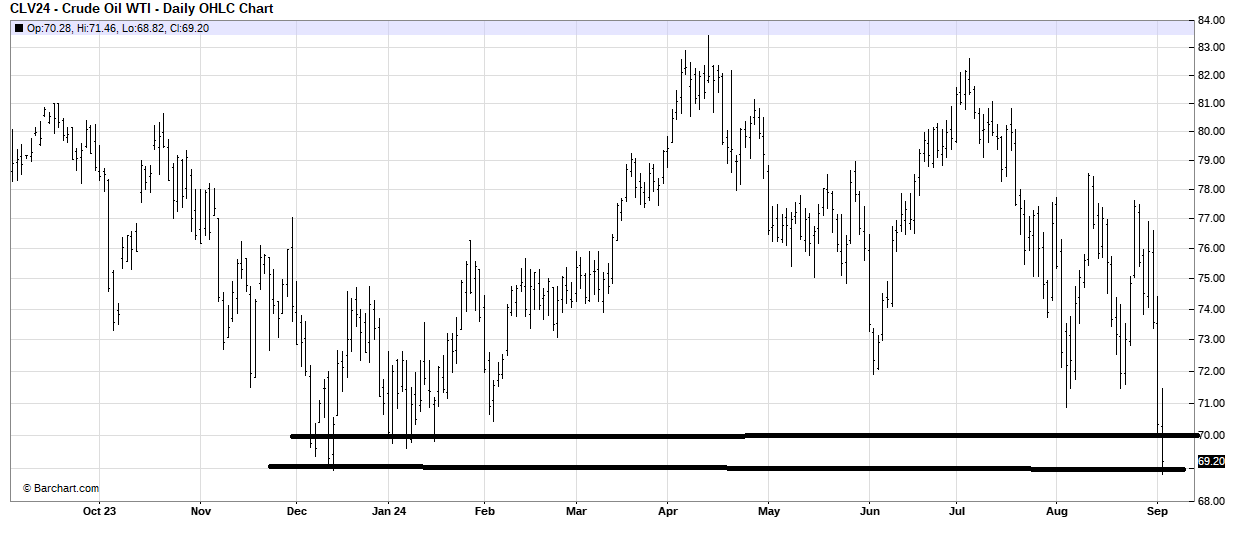
Elsewhere, I have been asked about Oil. I really thought this 70 area, from late last year, would hold on this trip down. That is looking tenuous now. It is getting oversold in the near term but with the Daily Sentiment Indicator at 58, I would not trust a rally to do more than bounce right now.