Next Moves for Ford Stock As Price Sees Worse Decline in Years
The auto giant is tumbling amid higher warranty costs and EV losses. Here's what investors can expect.
You've reached your free article limit
You've read 0 of 1 free Pro articles.
Ford Motor Company F gapped lower Thursday as investors fretted about profitability sinking on higher warranty costs and EV losses after the release of its latest quarterly reports following market close on Wednesday.
Let's check out the charts for Ford on its way to the body shop.
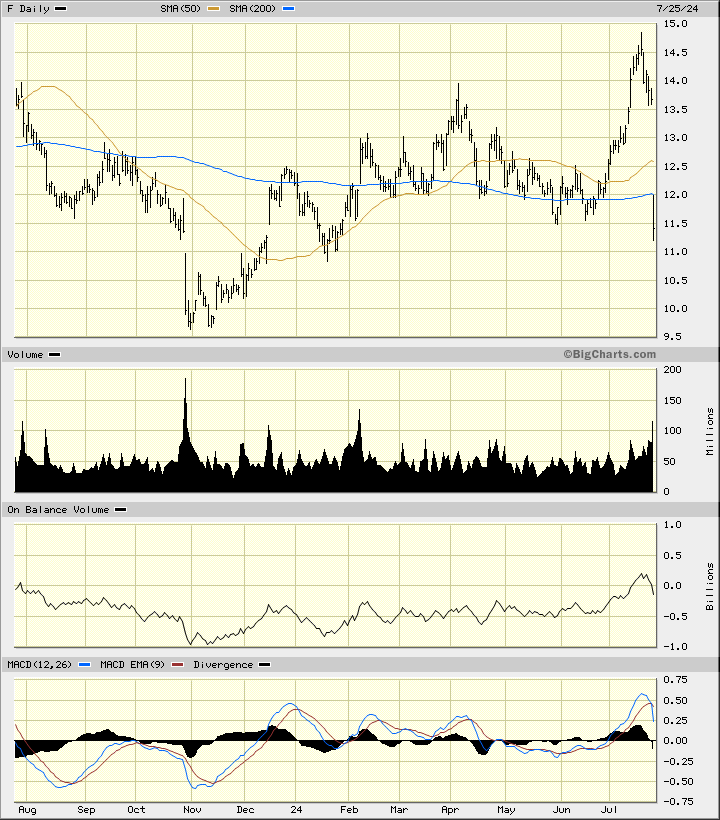
In this daily bar chart of F below, I can see a dramatic gap lower. Prices opened below the 50-day and the 200-day moving average lines. You don't see that all that often. Trading volume has surged higher today telling me that traders are voting with their feet. The On-Balance-Volume (OBV) line is now pointed lower and the Moving Average Convergence Divergence (MACD) oscillator has crossed to the downside. A retest of the zero line comes next.
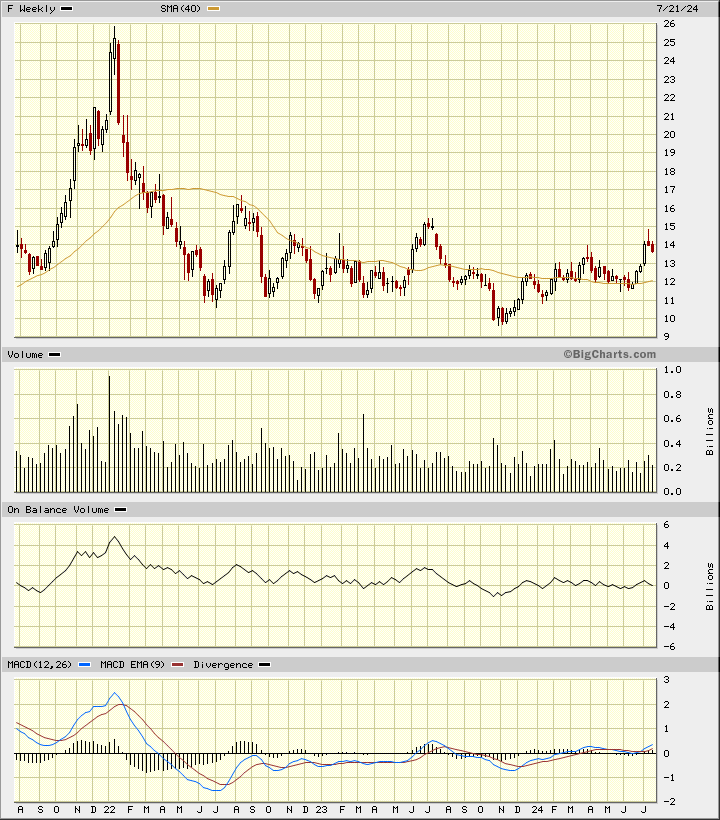
In this weekly Japanese candlestick chart of F below, I can see that last week prices made an upper shadow telling us that traders rejected the highs. The advance stopped short of the highs of 2023. The weekly OBV line has stayed weak. The MACD oscillator is only slightly above the zero line but that could change in the next week.
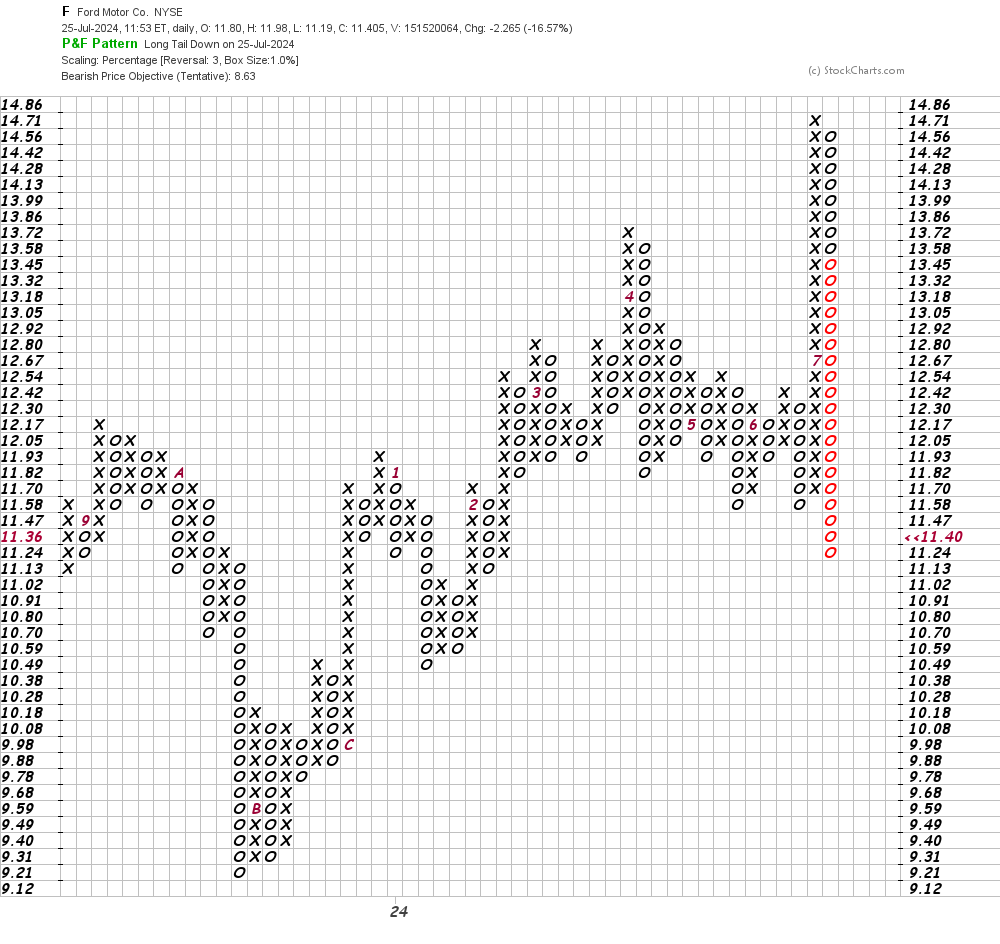
In this daily Point and Figure chart of F below, I can see today's decline with no price gap. Here the software is suggesting a downside price target in the $8.63 area.
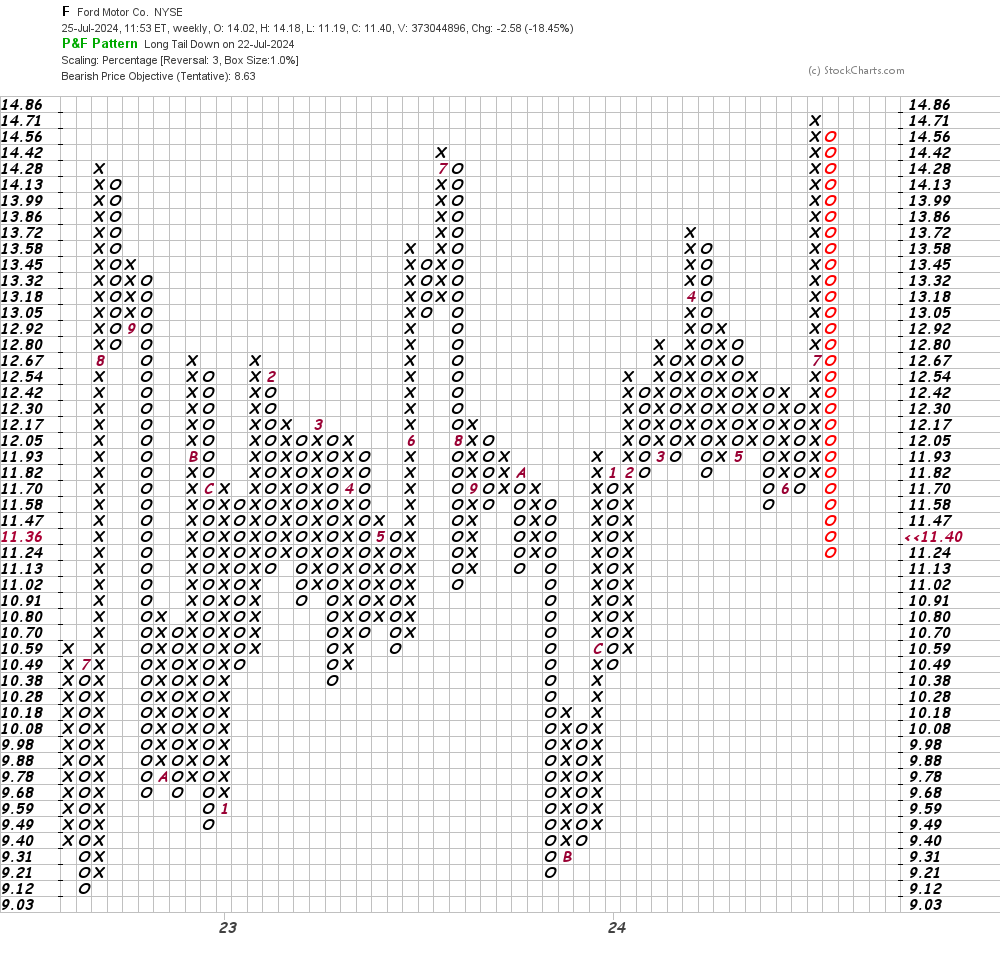
In this weekly Point and Figure chart of F below, I can see that the software is giving us the same downside price target of $8.63.
Bottom line strategy: The selling in F is pretty intense today and spillover selling in the days ahead will not be a surprise.
Employees of TheStreet are prohibited from trading individual securities.