What Is the Momentum Factor ETF Telling Us About Market Timing?
Price momentum is a leading indicator and is an easy-to-understand concept.
You've reached your free article limit
You've read 0 of 1 free Pro articles.
The iShares MSCI USA Momentum Factor ETF MTUM seeks to track the investment results of "an index composed of U.S. large- and mid-capitalization stocks exhibiting relatively higher price momentum." Price momentum is a leading indicator and is an easy-to-understand concept. Basically momentum investing is the belief that certain stocks in strong uptrends can continue rising, while stocks that are faltering are more likely to continue weak.
The question of the day is what is this ETF telling us today? Let's check out a few charts and indicators for the answer.
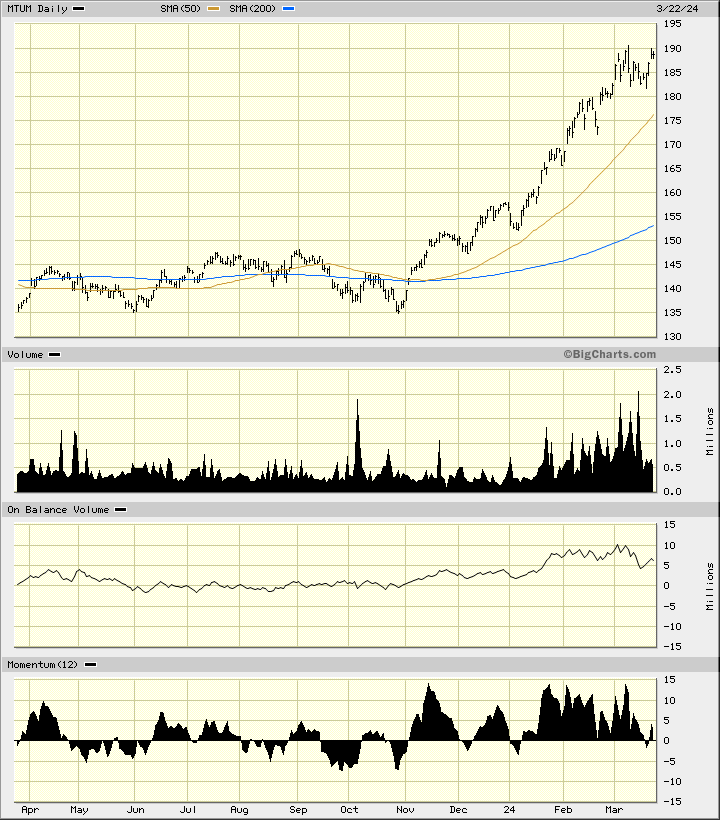
In the daily bar chart of MTUM, below, I can see that share prices have become stalled around $190. Trading has increased steadily since the middle of January but the daily On-Balance-Volume (OBV) line has started to turn lower. A weakening OBV line tells us that sellers of MTUM have become more aggressive than buyers with heavier trading volume happening on days when MTUM has closed lower on the day.
The 12-day price momentum study in the lower panel shows roughly equal highs since November even though prices made higher highs. This difference in movement between prices and the indicator is a bearish divergence. Bearish divergences can at times foreshadow a price decline.
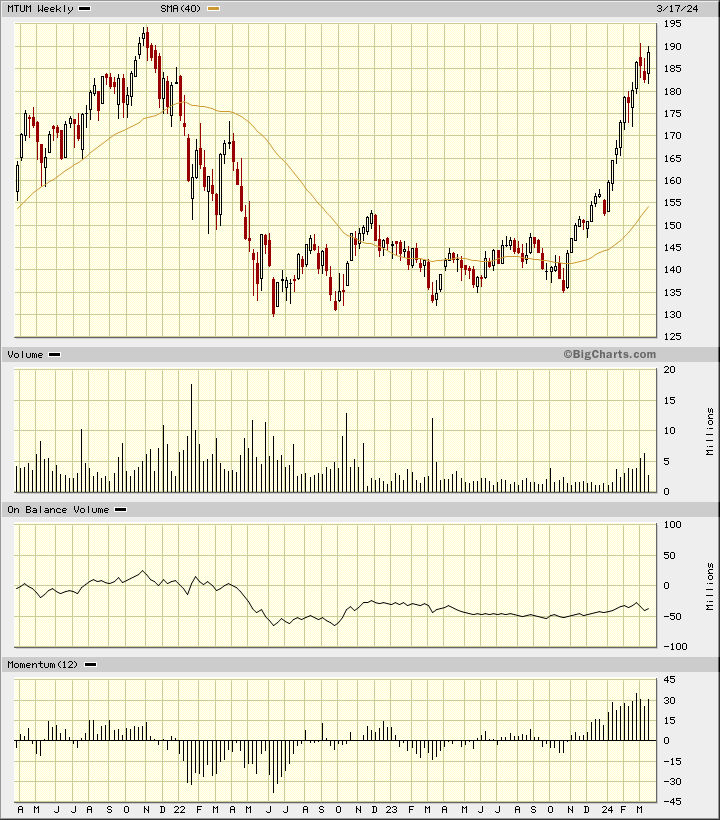
In the weekly Japanese candlestick chart of MTUM, below, I can see that the shares have rallied back towards the highs of late 2021. The weekly OBV line has been neutral for a long time.
The 12-week price momentum study has started to turn lower in recent weeks. The candles are showing us some upper shadows around $190 telling us that traders are rejecting the highs.
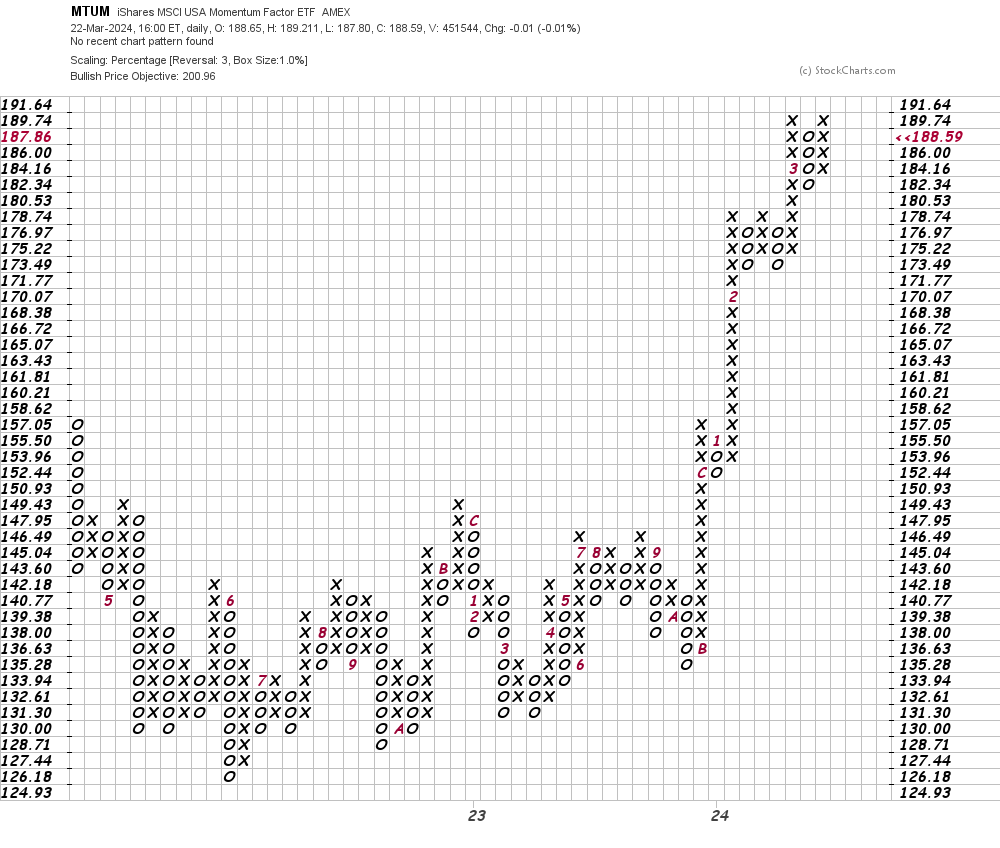
In this daily Point and Figure chart of MTUM, below, I can see a potential upside price target in the $201 area but a trade at $180.53 could weaken this chart picture.
Bottom-line strategy: There are probably some quantitative analysts rolling their eyes that I used technical analysis to analyze the MTUM, but I think the odds now favor a decline into the late summer or early fall for the broader market averages.
Employees of TheStreet are prohibited from trading individual securities.