What Did the Active Managers Really Think About the Rally?
As the market moves a bit higher, it's interesting to see what's happened to the NAAIM survey. We also look at XLE, SLV, COPX, BITO, CPNG, and RBLX.
You've reached your free article limit
You've read 0 of 1 free Pro articles.
The Market
Sure, I expected a rally late in the week, but not what we’ve seen. I also did not expect six straight up days, yet this is what we got.
And my short-term oscillator does not get overbought until next week. It is hard for me to imagine there will be two more days of upside like this but as noted above I did not expect this much of a short-term rally.
The upside volume clocked in at 85% of the total volume, so that is a positive although it does nothing to get the intermediate term Volume Indicator pushing toward an oversold condition.
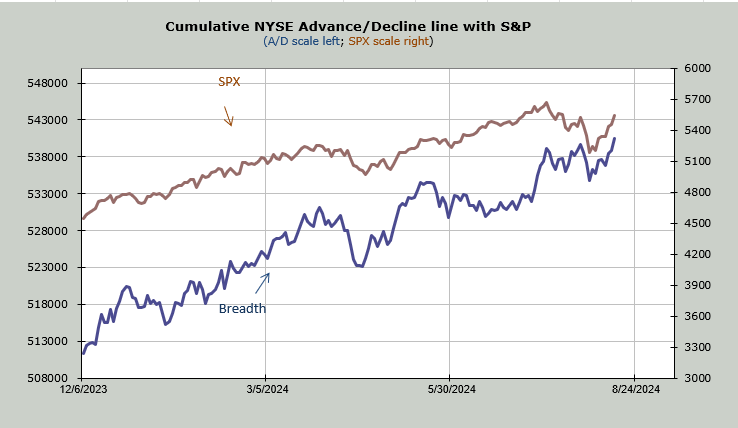
The NYSE cumulative advance/decline line made a new high. Therefore breadth, even though today’s breadth was not as good as the previous big up days, did make a higher high.
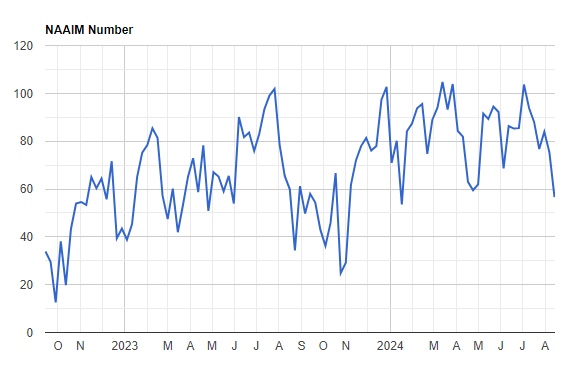
However it is sentiment that is fascinating. We’ve discussed the Investors Intelligence readings which are now on the bullish side of the ledger. The AAII are more mixed to me. However, last week the NAAIM folks had not done anything to their exposure yet this week, as we rallied –well the indexes rallied, until today that was where all the action was—they reduced exposure down to 56. So, this moves to the bullish side of the ledger.
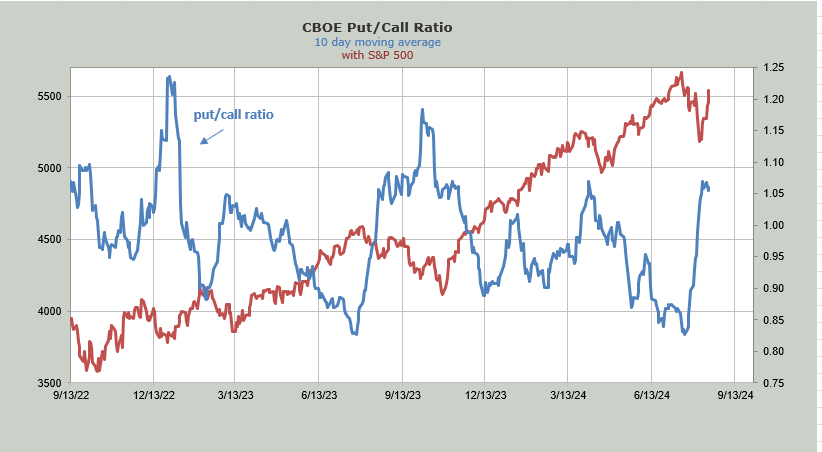
Even the ten-day moving average of the put/call ratio is rolling over, which is bullish. The chart is shown below.
However, anecdotally, I think today shifted a lot of minds. I have been thinking we pull back next week, and I still think so.
New Ideas
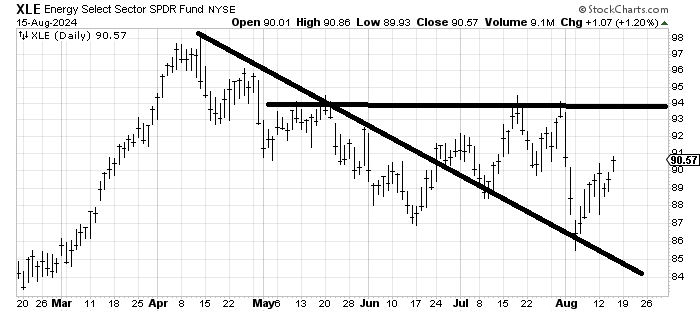
My inbox is filled with questions on XLE. My response has been that I like XOM, but it can’t get over 120. I also liked EOG last week, and while it has moved up it can’t seem to clear the 128-129 area.
XLE is okay in that it ought to play catch up, but resistance at 94 looks tough.
Today’s Indicator
The ten-day moving average of the put/call ratio is rolling over.
Q&A/Reader’s Feedback
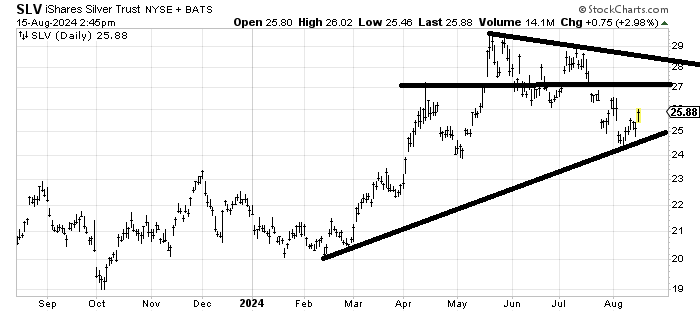
SLV looks to be enjoying an oversold rally from support. There is too much resistance at 27-28 for me to embrace it here, but I do think it should get to that resistance.
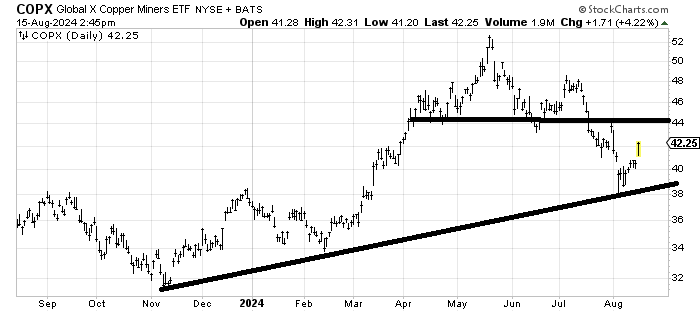
I would remind you that a few weeks ago the DSI for copper got to 10 and I did like it, and still do. The chart bounced right off support and had become hated. I think there is resistance at 44 but that move to 38 looked like a cleanout to me.
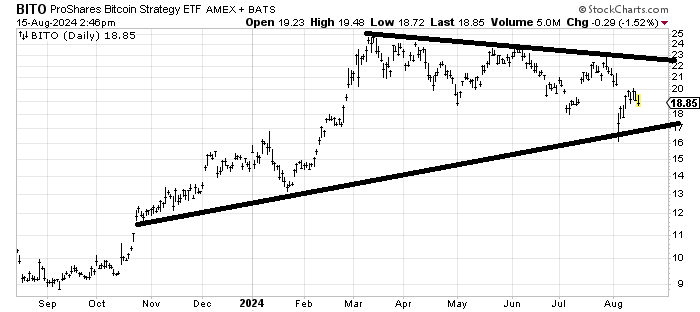
This trip down will be a good test for BITO, an ETF to be long Bitcoin. The chart looks like a giant top but it has that spike low which I believe should hold on the first trip down there. I would think, similar to the GOOGL chart we looked at a few days ago, it holds the spike low and rallies.
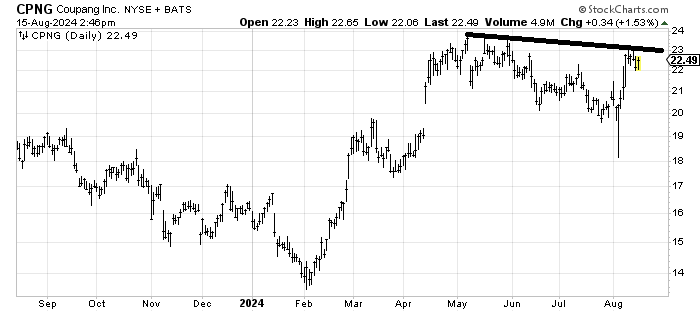
Coupang (CPNG:NYSE) has a lot of resistance up here, but that cleanout spike low which also filled a gap, was a positive. I’d like to see it cross 23 in the next few days. I fear waiting around to do so will bring out too many sellers.
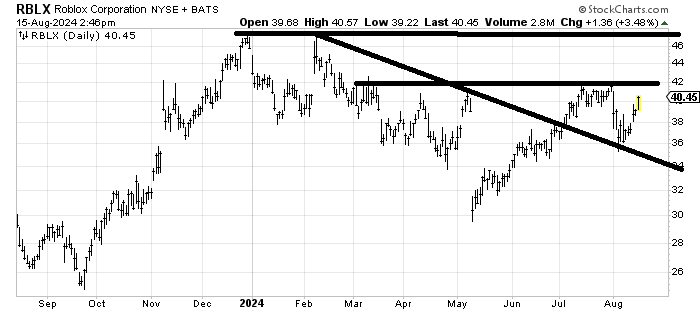
Roblox (RBLX:NYSE) is an interesting chart because it made its low months ago, in May. My guess is if it gets up to/over 42 next week it will be due for a pullback shortly thereafter but it’s a positive chart to me.