Was Yesterday Just a Blowoff?
Lots of giveback among individual names today. Is this a pause or the start of something else? Today's new idea is BWA, and we'll look at reader questions.
You've reached your free article limit
You've read 0 of 1 free Pro articles.
The Market
There was an awful lot of giveback today. Oh, the indexes didn’t show it that much, but stocks surely did. They need to hold quickly, or some of these charts will look like that was a blow-off. Just look at JP Morgan JPM.
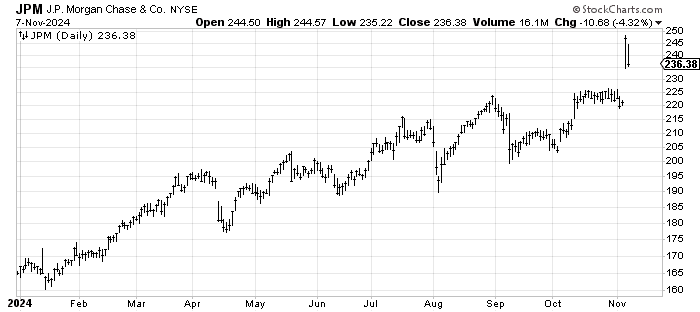
Of course, moderate giveback is expected after a day like Wednesday, but not total giveback. We’ll keep an eye on that since breadth was not a leader again today. It was merely okay.
We can see the giveback in the drop-off in stocks making new highs where the NYSE had 200 fewer new highs today than Wednesday, and Nasdaq was a bit more than that. The good news is the new lows didn’t expand, although Nasdaq is still clocking in at over 100 new lows, something we rarely see with the market at new highs. Yet, we are not yet overbought.
Then there are bonds. Oh sure, they rallied, which gives me a small modicum of relief, but I wanted a surge! Note that the Utes were down slightly on the day, so they ignored the move in bonds. I am still in the camp that thinks rates back up, but there are a lot of pitfalls on that road. The DSI is back up to 21.
Speaking of the DSI, the S&P is at 82 and Nasdaq is at 83. Once they get over 85 the runway gets short. But the big move was in the DSI for the VIX. Recall earlier this week we discussed that very high put/call ratio for the VIX which showed a lot of puts being bought and I said it was not contrary because we want to be on the same side as these pros who trade it.
Well, now the DSI for the VIX is at 10. That means if we do get the S&P up to that 6000 area (remember that island measures there) in the next day or two, it is likely the VIX DSI will be single digits and the S&P and Nasdaq will be over 85.
There’s a lot of moving parts.
New Ideas
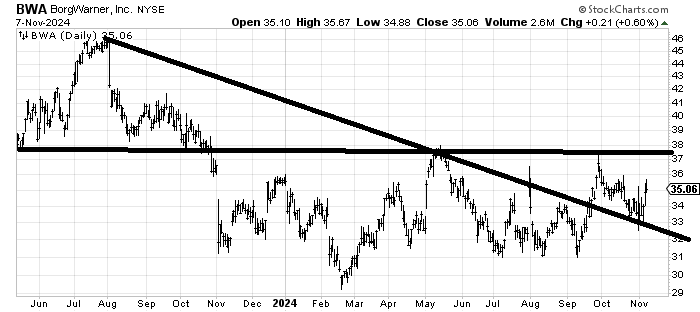
The chart of BorgWarner BWA is interesting again because it has now spent so much time going sideways—an entire year!
Today’s Indicator
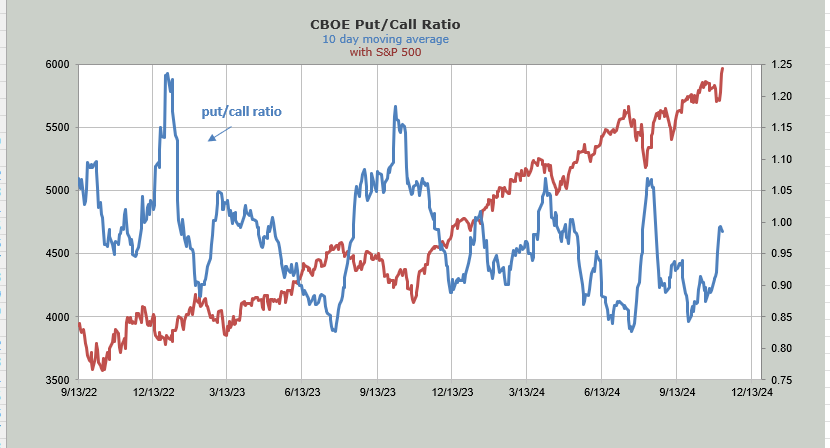
The ten-day moving average of the put/call ratio continues to sit at .99, despite today’s reading coming down to .83
Q&A/Reader’s Feedback
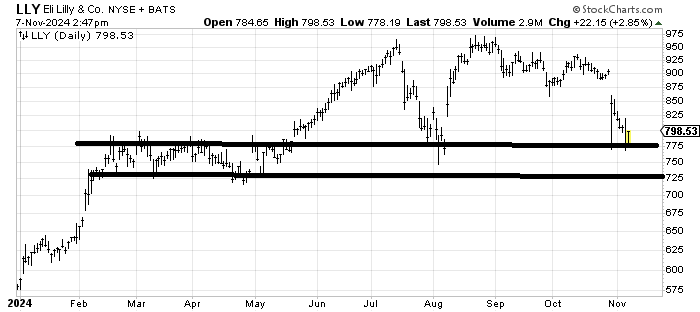
Somewhere in this 725-775 area Eli Lilly LLY should start to hold. Your preference should be the top of the range rather than the bottom. Quite frankly the chart looks like a giant top so I would say it’s going to take time to repair the chart. I would like to see it bounce to around 825-850 then back down and hold support. That would at least give us a pattern.
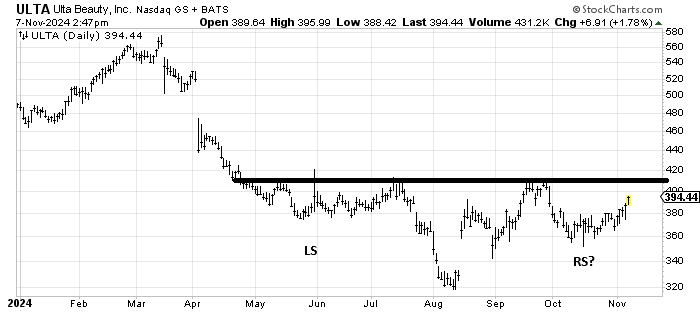
The right shoulder is lower than the left shoulder so to call this chart of Ulta Beauty ULTA a proper head and shoulders is a stretch. However it does look like a bottoming chart so I like it. That 410 area ought to be resistance the first time up there.
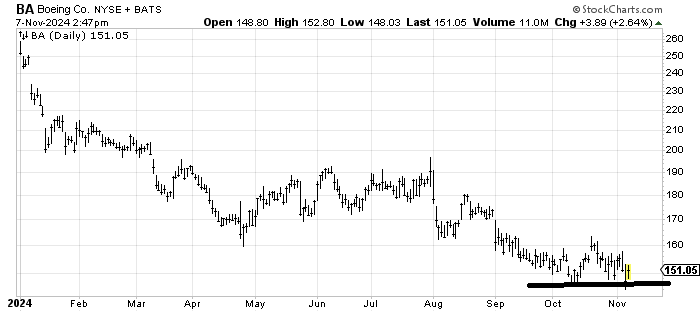
We looked at Boeing BA a few weeks ago and I noted that once they did a secondary and if the stock could hold the lows it was probably okay to dip a toe in. I still feel that way, even though the stock probably has some tax loss selling ahead of it. If it can keep holding down in this 145 area for a few more weeks it is possible it sets up better for 2025.