Wall Street Drops the Ball on Salesforce
Bearish clues were out there, but apparently this price action escaped the attention of analysts.
You've reached your free article limit
You've read 0 of 1 free Pro articles.
A philosopher once said, “To know what you know, and to know what you don’t know, is the mark of one who knows.”
When it comes to investing, there are two competing schools of thought. Thursday’s action in Salesforce CRM highlights the difference in these approaches.
Some investors believe that every data point deserves scrutiny. Here's the problem: While it’s important to understand your investments, you’ll never have all the information at your disposal. Someone will always know something that you don’t know.
A different school of thought recognizes that not everything is knowable. This group monitors price for clues about the actions of those in the know — institutional investors. If institutions are buying or selling, clues will be left behind, in the form of chart patterns and volume.
How does this relate to Salesforce?
The San Francisco-based customer relationship management software provider beat earnings estimates. In the just-ended quarter, Salesforce earned $2.44 per share, vs. estimates of $2.37.
While revenue climbed 11% from the year-ago quarter to $9.13 billion, analysts were looking for $9.15 billion. That’s not a huge miss, but in the current market environment, tech-focused companies like Salesforce need to beat both earnings and revenue estimates handily.
The big problem was guidance. Most revenue estimates for the current quarter were near $9.35 billion, but Salesforce guided that figure lower, to the $9.2 billion-$9.25 billion range.
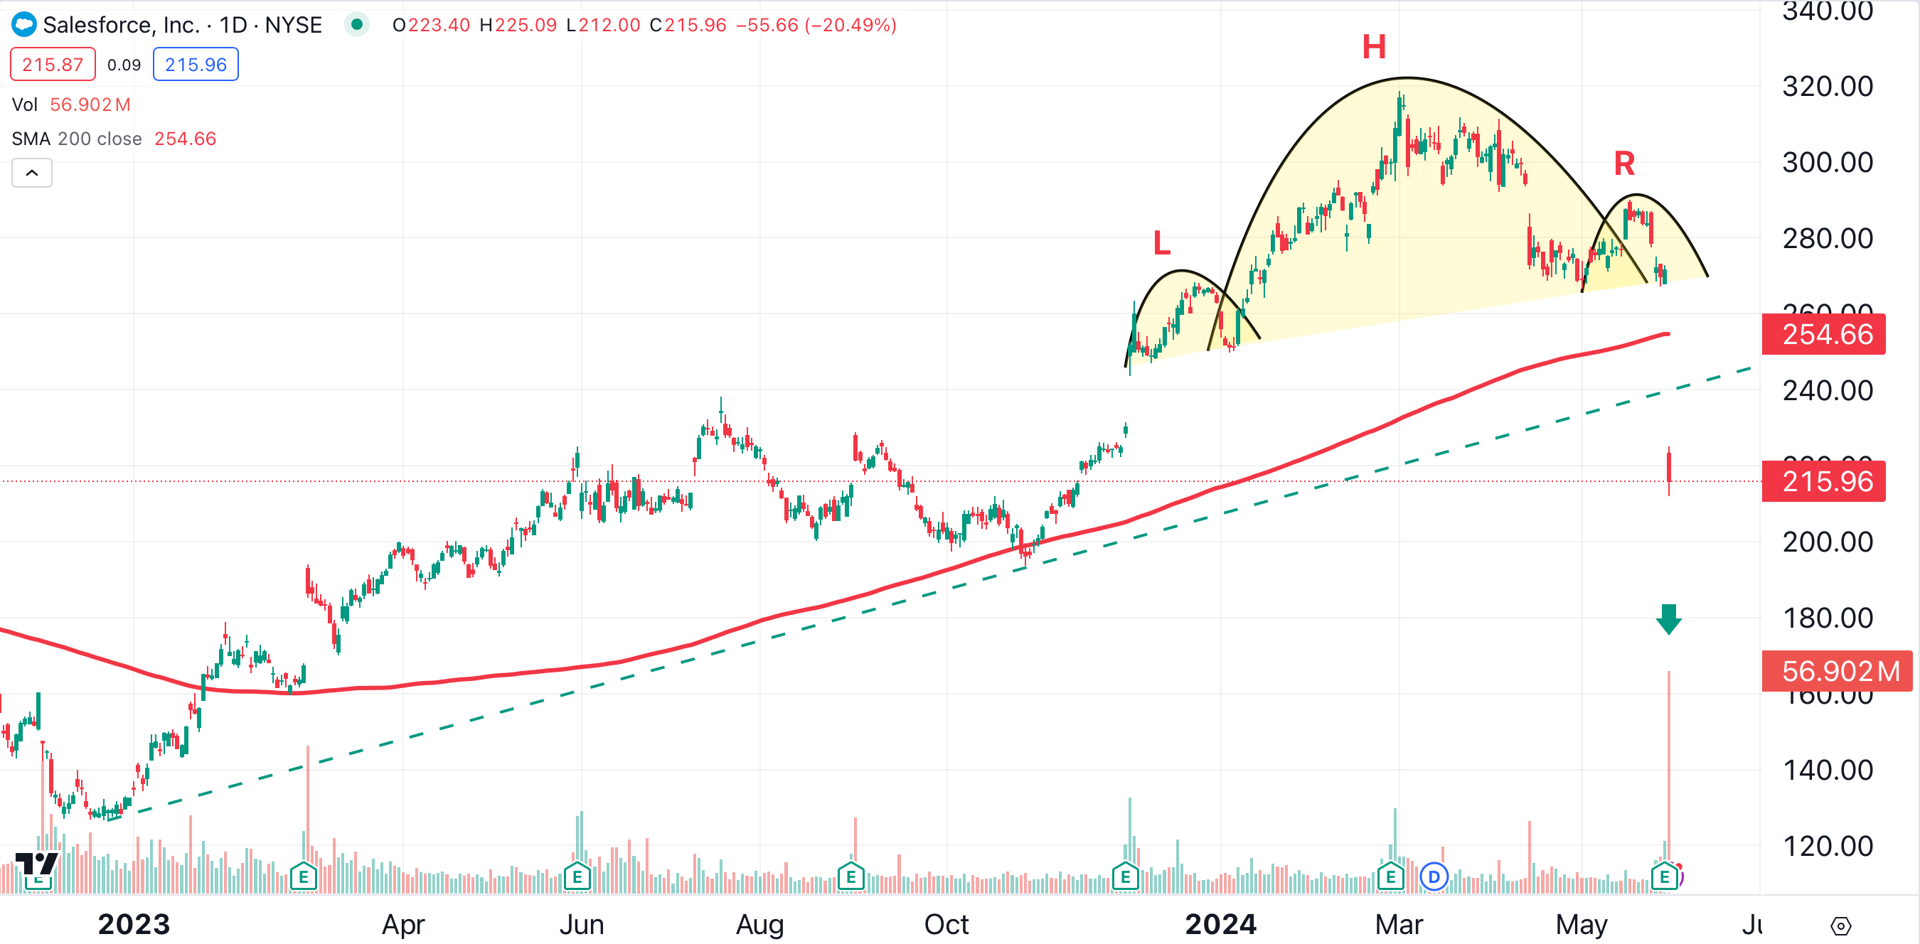
On Thursday, investors responded by dumping Salesforce, causing a 20% decline. The stock saw its heaviest volume since 2020 (green arrow), indicating the presence of institutional sellers.
Should investors have seen this coming? According to the charts, the answer is yes — but only for those who know what they don’t know.
Over the past six months, Salesforce formed a massive head-and-shoulders topping pattern (shaded yellow). This bearish pattern projects the stock to the $200 area, so investors should expect some follow-through to the downside.
The significance of this bearish price action apparently escaped the attention of analysts. Perhaps they were busy collecting and appraising as many data points as possible. Somehow, they missed the chart.
Prior to this week’s earnings report, 28 analysts gave Salesforce a "buy" rating, while 10 rated the stock as a "hold." None of the analysts had a "sell" rating on the stock.
Salesforce is now trading below its bullish trendline (green dotted line) for the first time in over a year. The stock has fallen beneath its 200-day moving average (red) for the first time this year.
This isn’t to say that chart analysis is perfect. If it was, investing would be a lot easier, and success would be more common. But technical analysis can fill some of the gaps left by fundamental analysis. In the case of Salesforce, that’s a very large gap.
At the time of publication, Ponsi had no positions in any securities mentioned.
