Updating the Indicators Before Things Get Interesting
Monday's breadth was fair but not great, so let's look at the indicators to see if things are about to change. Plus, VZ, BAX, OIH, SNAP, DDOG, CRM, and ABNB.
You've reached your free article limit
You've read 0 of 1 free Pro articles.
The Market
You know what changed today? Nothing.
I mean, when breadth is fair, not great, and the upside volume chimes in at 70% is there really anything noteworthy?
When the QQQs rally but are mostly sloppy, is that noteworthy?
But there are a few indicators to update. First and foremost, the put/call ratio was 1.11 on an up day, which makes this now two days we got readings over 1.0. While the ten-day moving average of the put/call ratio is still only .94 my take is that folks did not seem to rush to buy calls today which ultimately will be a plus. And it’s a change from last week.
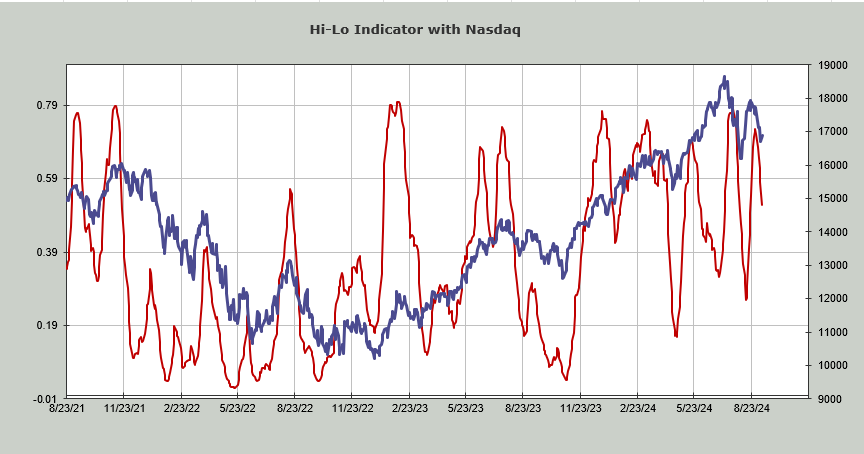
Then there is the Hi-Lo Indicator. New highs did not come close to Friday’s readings, and considering the market was up from the opening bell, I’d say the new lows did not contract as much as they should have. But that means the Hi-Lo Indicator is now .52. It’s motoring toward oversold.
Then there are the small caps and you can barely see today’s rally on the chart.
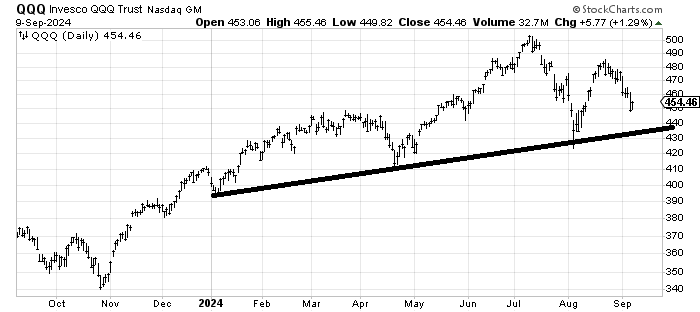
I don’t know what tomorrow or the next few days will bring in the market but considering my work says we’d be at a good short-term oversold condition this week, I will say if the QQQs come near that line as we get to the end of the week, they are a buy for a trade, especially if they do it on volume.
I know it has become contrarian to think the QQQs can rally, but that is my view for the time being, that’s where we’re the most oversold.
New Ideas
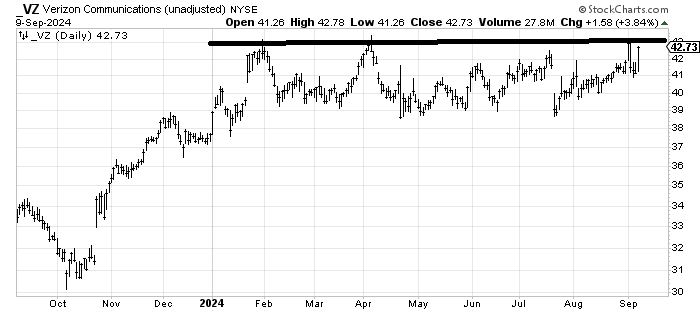
With AT&T doing so well, I was asked about Verizon VZ. I believe we looked at the stock two months ago. It was around 42 and I was non-plussed with the chart. It has shaped up better now, so I’d say over 43 and it could enjoy a little run.
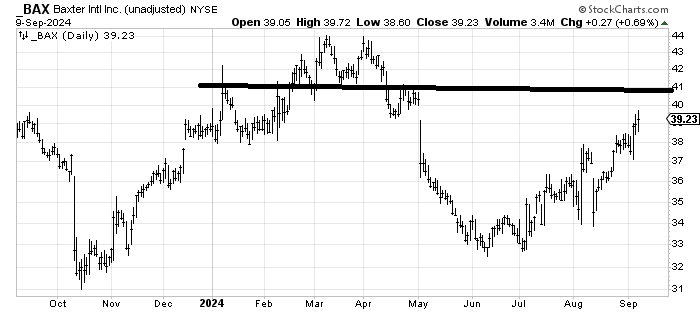
I recommended Baxter BAX months ago and it has been a volatile ride up with a lot of shakeouts along the way. The first target is 40-41 from the gap fill and the resistance. I wouldn’t argue if you wanted to take a little off the table up there.
Today’s Indicator
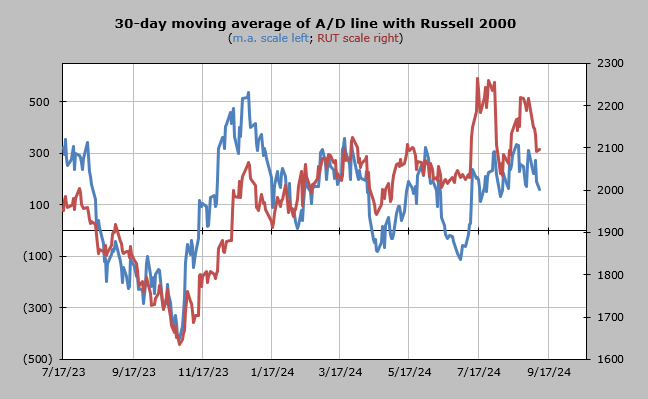
The 30-day moving average of the advance/decline line is still not oversold.
Q&A/Reader’s Feedback
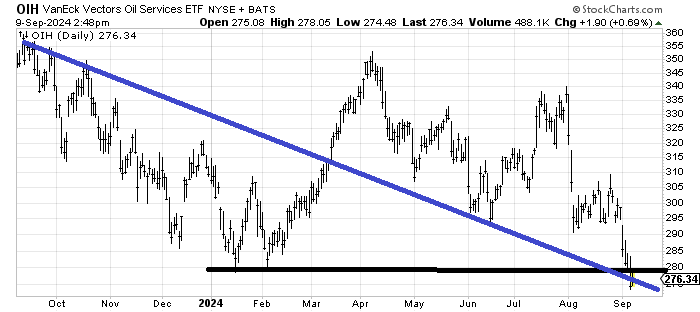
The break of the black line at 280 on the Oil Services ETF OIH should be a death knell for the chart because it would then measure to the 200 area. However, the fact that there is a downtrend line (blue) that has given way to a bounce each time it has been hit in the last year has me with a wait-and-see on this chart. Can it get back over 280? If it can, I’d call this a false breakdown. If it can’t do so in the next week or so then the stock measures lower. 200 might be extreme, but that’s the measured target.
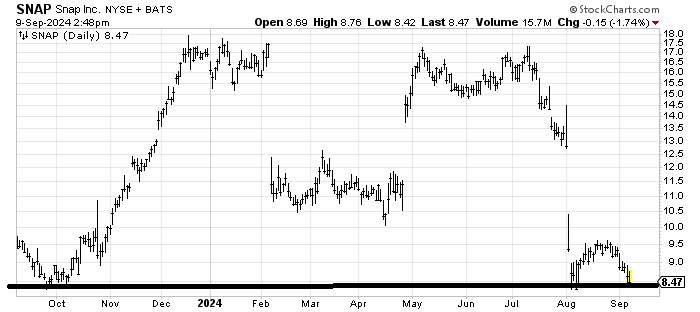
If Snap SNAP can hold this 8.40 area for the next several days, then I’d look for a bounce. I would not overstay my welcome though, because as the calendar turns to October, tax loss selling season kicks in (for mutual funds), and this stock would be a great candidate for that.
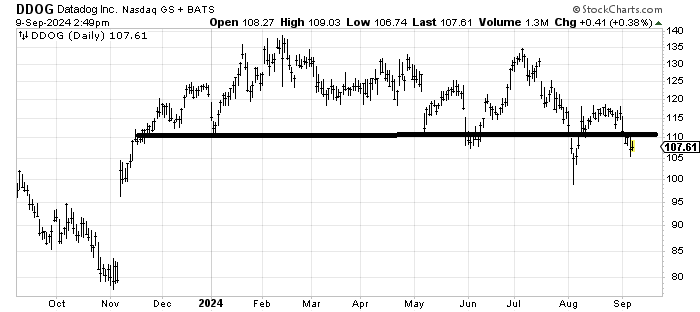
Datadog DDOG looks like it will retest that spike low near 100 or maybe even fill the gap near 80. I’d be a seller on a rally to the 115 area.
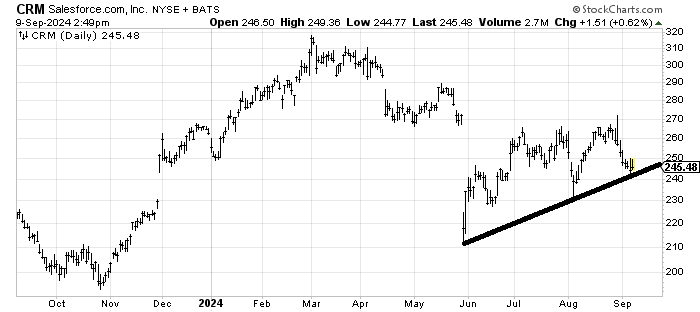
If Salesforce CRM can stay over this line for several more days, then I would say it sets up for a short-term oversold rally. In fact, I would use a stop under 240.
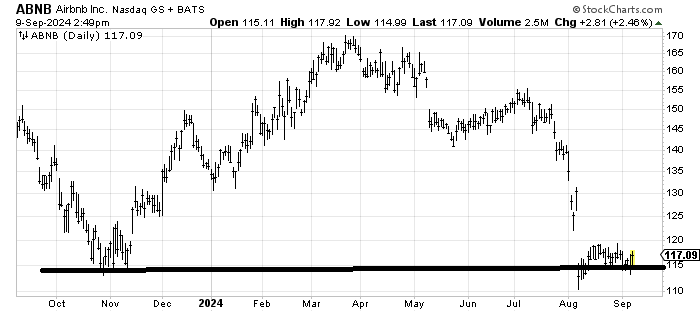
Airbnb ABNB Looks to me as if it can fill that gap around 122-125. This would also be a candidate for tax loss selling so don’t overstay your welcome into a rally.