We're Updating Our Strategy on Chewy As Share Price Soars
Share prices for the online pet supply company soared this week, calling for a renewed review of the charts.
You've reached your free article limit
You've read 0 of 1 free Pro articles.
On June 3, 2024, I reviewed the charts of online pet supply company Chewy CHWY and wrote that "Aggressive traders could go long CHWY at current levels, risking to $17."
Let's check out some updated charts.
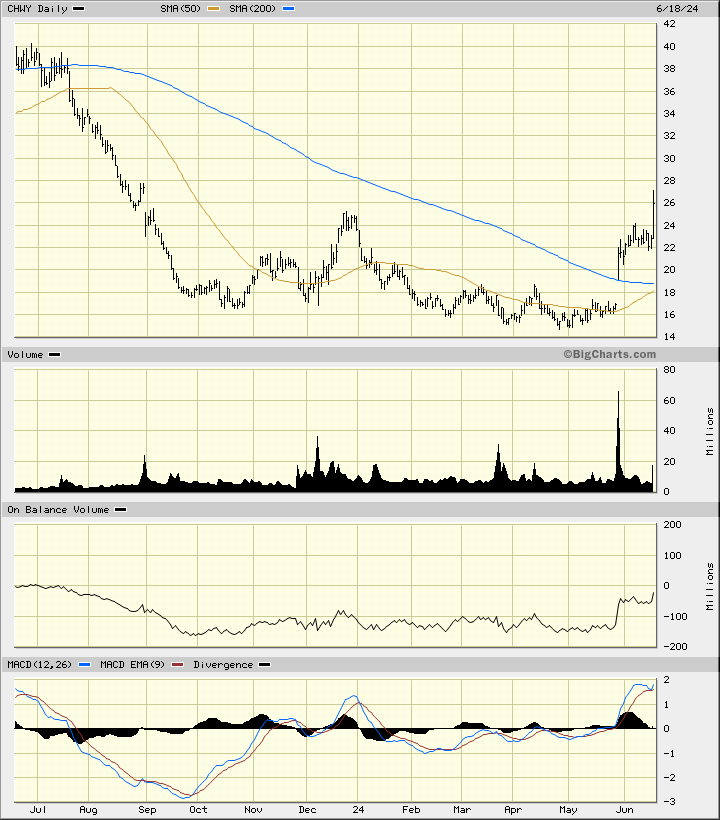
In this daily bar chart of CHWY below, I can see that prices traded sideways after our June 3 buy recommendation but prices rallied strongly on Tuesday. CHWY trades above the rising 50-day moving average line and above the bottoming 200-day line. The On-Balance-Volume (OBV) line has moved higher to confirm the price gains. The trend-following Moving Average Convergence Divergence (MACD) oscillator is above the zero line.
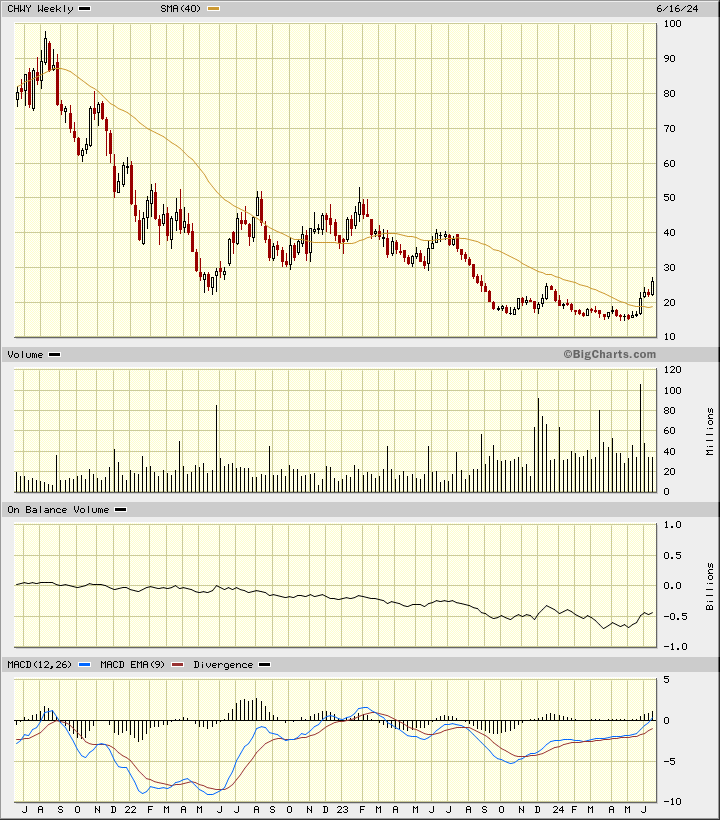
In this weekly Japanese candlestick chart of CHWY below, I can see a picture that continues to improve. Prices are trading above the bottoming 40-week moving average line. The weekly OBV line has broken a long downward trend and started a new rising pattern. The MACD oscillator is now crossing above the zero line.
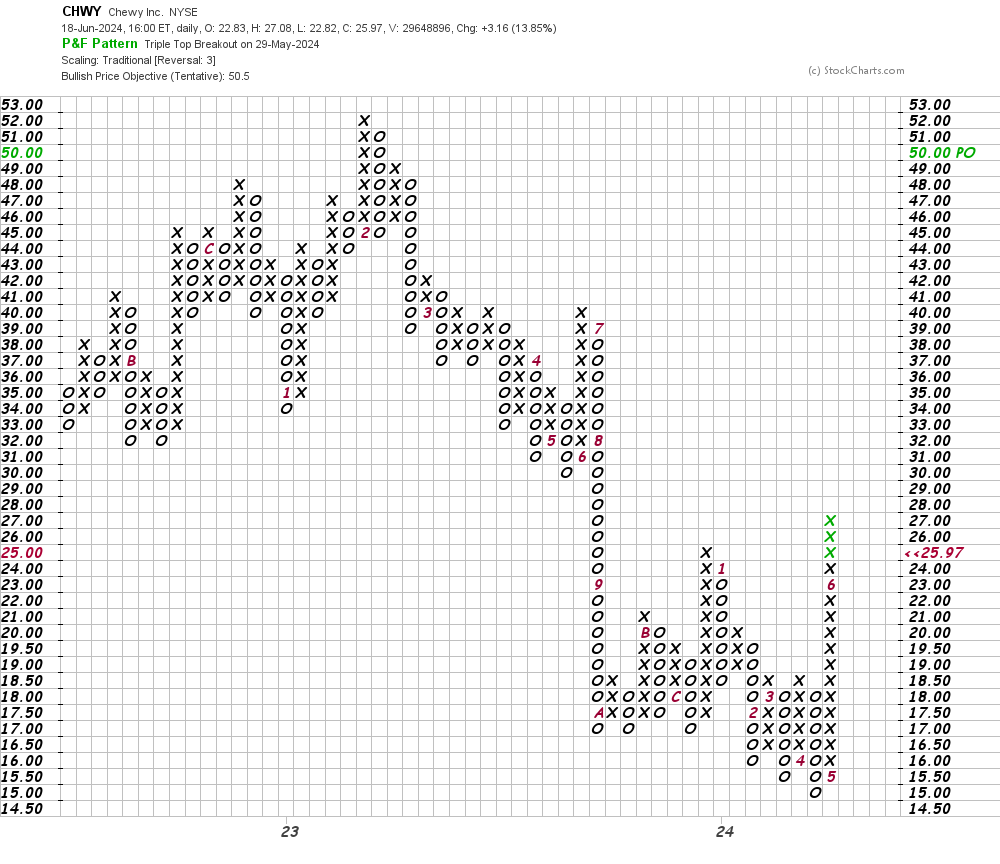
In this daily Point and Figure chart of CHWY below, I can see a potential upside price target in the $51 area.
In this second Point and Figure chart of CHWY below, I used weekly price data. Here the chart shows us the same $51 price target as the daily chart above.
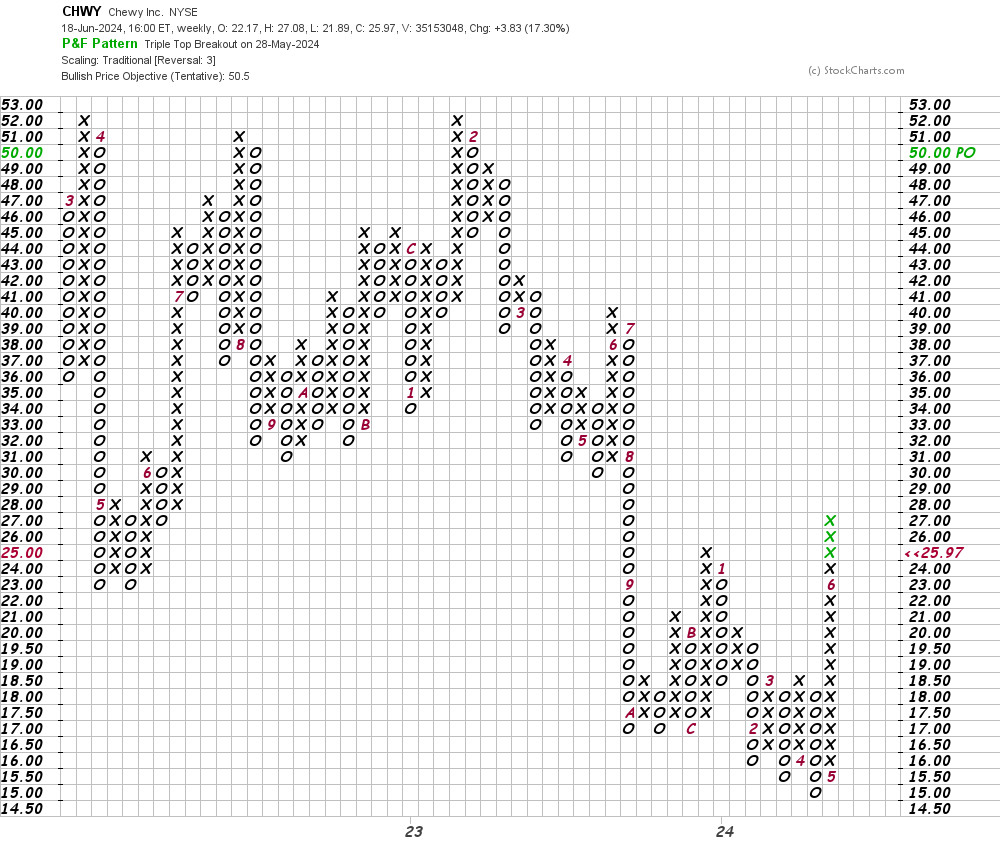
Bottom line strategy: The share price of CHWY soared sharply on Tuesday and we are likely to now see a few days of sideways price action before further gains. The $51 area is our Point and Figure chart target. Raise stop loss orders to $20 from $17.
Employees of TheStreet are prohibited from trading individual securities.