Aggressive Traders Will Want to Take a Big Bite Out of Chewy
Pet supply company Chewy has been trading above the 200-day moving average, with bullish indicators suggesting more growth.
You've reached your free article limit
You've read 0 of 1 free Pro articles.
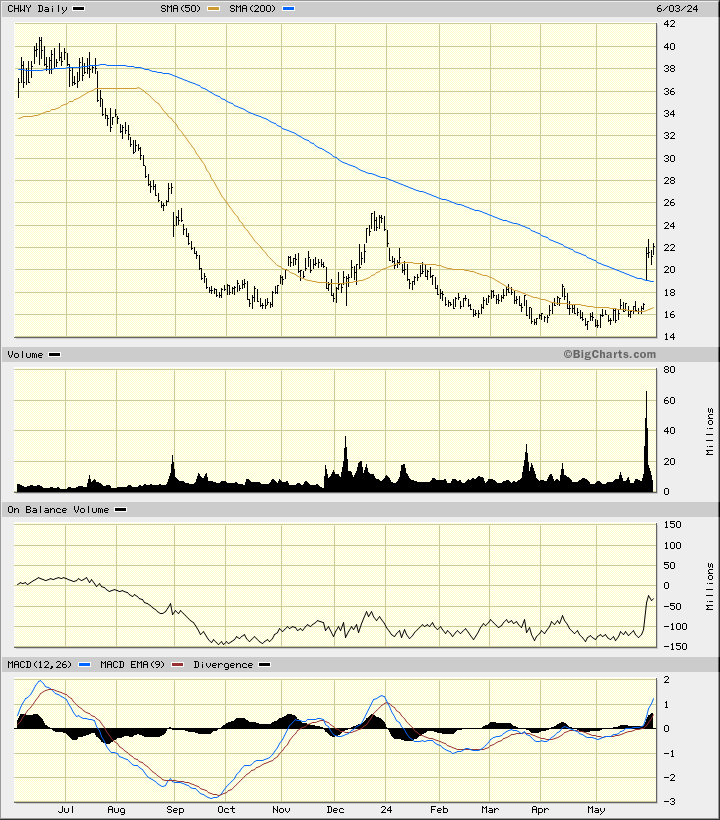
Online pet supply company Chewy CHWY has spent the past few days trading above the 200-day moving average line. Let's check out the charts and indicators.
In this daily bar chart for CHWY below, I can see a positive picture. Prices are trading above the rising 50-day moving average line. The 200-day line is starting to bottom. The On-Balance-Volume (OBV) line has turned higher and the trading volume has increased in recent days. The Moving Average Convergence Divergence (MACD) oscillator is in a bullish rise above the zero line.
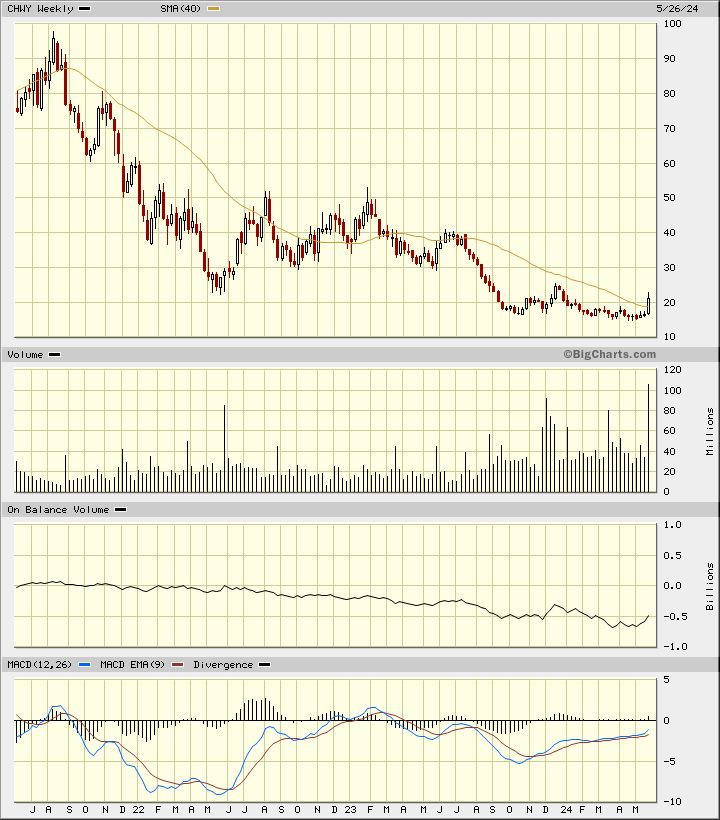
In this weekly Japanese candlestick chart for CHWY below, I can see that prices are breaking a longer-term downtrend line (not drawn). Prices are trading above the 40-week moving average line. The weekly OBV line shows improvement since March. The MACD oscillator has been improving but remains below the zero line.
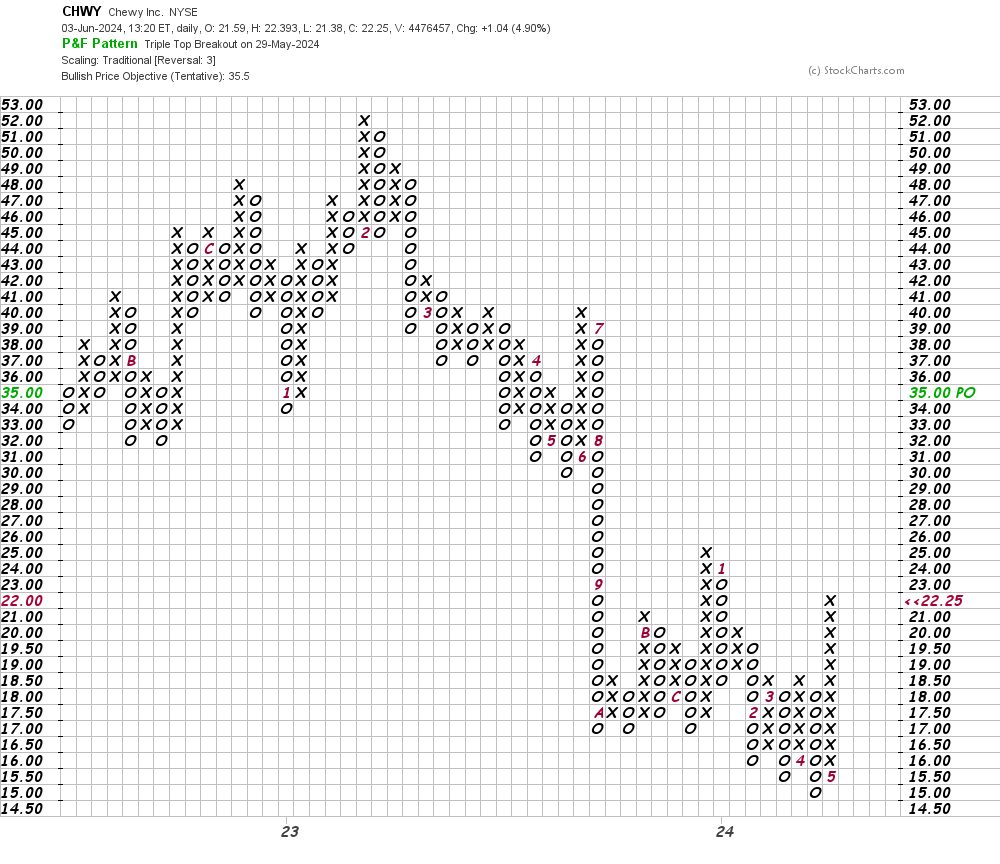
In this daily Point and Figure chart for CHWY below, I can see an upside price target in the $36 area.
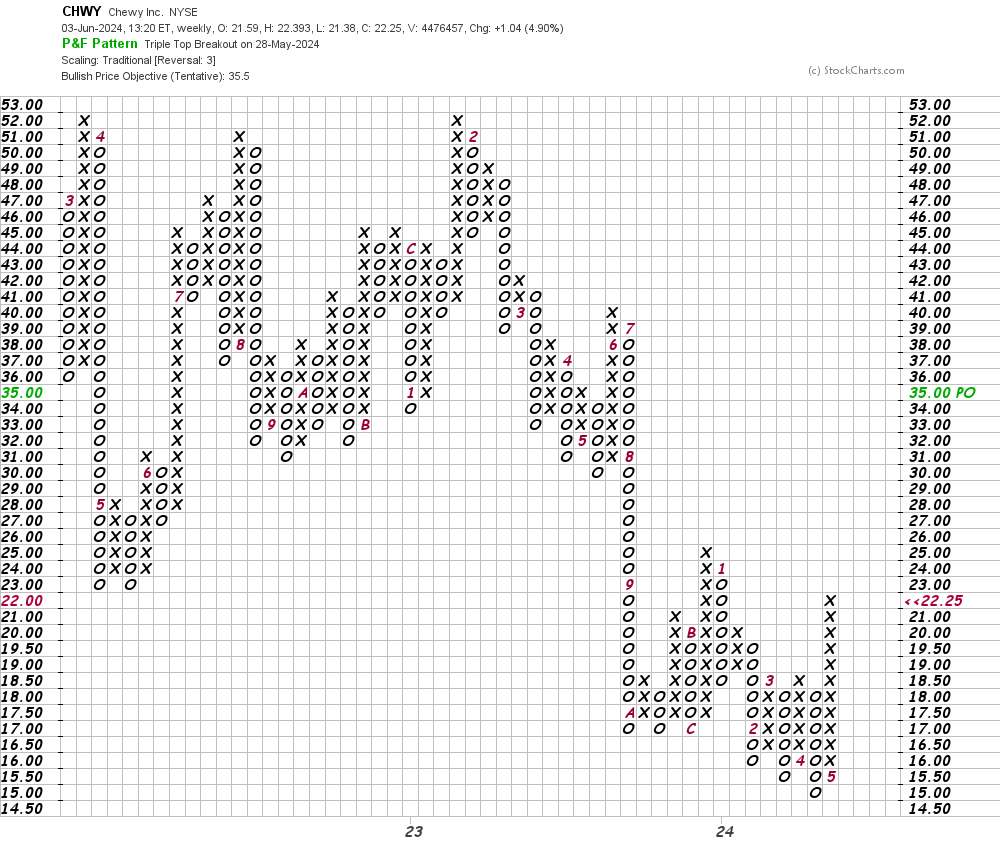
In this weekly Point and Figure chart of CHWY below, I can see the same $36 price target as shown on the daily chart above.
Bottom line strategy: Aggressive traders could go long CHWY at current levels, risking to $17.
Employees of TheStreet are prohibited from trading individual securities.