A Trade for the Bulls Following Dell's AI-Related Beat
After the high-tech provider posted a big quarter, here's a trade idea for those who might be feeling bullish.
You've reached your free article limit
You've read 0 of 1 free Pro articles.
On Thursday evening, PC maker and high-tech goods and services provider Dell DELL released the firm's fiscal second quarter financial results. For the three-month period ended August 2, 2024, Dell posted an adjusted EPS of $1.89 (GAAP EPS: $1.17) on revenue of $25.026 billion. These numbers all easily beat consensus view, while the sales print was good for year-over-year growth of 9.2%. Adjustments were made for a number of reasons. Among them were stock-based compensation, the amortization of intangibles and other corporate expenses, partially offset by an aggregate adjustment for income tax.
This was a big quarter for Dell, largely because the performance beat Wall Street's expectations by a wide margin, showing that infusing generative AI into a firm's goods and services and not just at the GPU/CPU level, can indeed boost sales and perhaps later, profitability.
Operations
As revenue generated, sported year over year growth of 9.2%, product-driven revenue increased 12% to $18.954 billion, while services-driven revenue grew 1% to $6.072 billion. The cost of revenue across the firm increased 12% to $19.715 billion, leaving a GAAP gross profit of $5.311 billion (-1%) on a gross margin of 21.2%, down from 23.5%. Adjusted gross margin dropped from 24.1% to 21.8%.
Total operating expenses decreased by 6% to $3.969 billion, leaving a GAAP operating income of $1.342 billion (+15%) on an operating margin of 5.4%, up from 5.1%. Adjusted operating margin dropped from 8.6% to 8.1%. After accounting for interest, other income/losses and taxes, net income attributable to Dell shareholders increased a whopping 83% to $846 million. (Income tax expense dropped 43%.) This works out to a GAAP $1.17 per diluted share, up from $0.63 for the year ago comparison, or $1.89 when adjusted versus $1.74.
Segment Performance
- Infrastructure Solutions Group (ISG) generated revenue of $11.646 billion (+38%), producing operating income of $1.284 billion (+22%)
- Servers and Networking sales were up 80% to $7.672 billion
- Storage sales were down 5% to $3.974 billion
- Client Solutions Group generated revenue of $12.414 billion (-4%), producing operating income of $767 million (-21%)
- Commercial sales were up very small to $10.556 billion
- Consumer sales were down 22% to $1.858 billion
Note: The ISG Segment is where the worry over AI and AI-related margin was. We see 80% sales growth to $7.672 billion there. What's so stunning and optimistic about that is that Wall Street was looking for less than $6 billion for that print. Additionally, for that segment, EBIT margin printed at 11%, which was up 350 basis points from the same period a year earlier.
Guidance
For the current quarter, the firm sees revenue of $24 billion to $25 billion, which would be 10% growth from the year prior at the midpoint. That's just a tick below the $24.6 billion that Wall Street had in mind. The ISG segment is projected to grow sales in the low 30%, while the CSG segment is flat to up low-single digits. Operating income margins are expected to improve as the ISG segment drives profitability. Adjusted EPS for the quarter is projected at $2.00 give or take a dime. This too is below Wall Street's view that was for a rough $2.20.
For the full year, Dell sees revenue of $95.5 billion to $98.5 billion. Again, at the midpoint, this would be 10% growth. This is also perhaps where the early strength in the share price is coming from as Wall Street was looking for something close to $96.3 billion. The ISG segment is seen growing sales by a rough 30% for the year as well, driven by AI and ongoing momentum in the traditional server business. Operating margins are expected to be within the firm's framework for the year, between 11% and 14% for the ISG business and between 5% and 7% for the CSG business. Adjusted EPS is projected at $7.80, up or down a quarter. Wall Street was looking for $7.70.
Fundamentals
For the quarter reported, Dell generated operating cash flow of $1.34 billion. Out of that number came capex spending of $636 million to leave free cash flow of $740 million. The firm in its press release is touting adjusted free cash flow of $1.284 billion by including $487 million in financing receivables and another $93 million in equipment currently under lease. Out of that free cash flow number, the firm repurchased $725 million worth of common stock and paid out $316 million in cash dividends to shareholders.
Turning to the balance sheet, Dell ended the year with a cash position of $4.55 billion and inventories of $5.953 billion, pushing current assets to $37.543 billion. Current liabilities add up to $52.033 billion, while that includes short-term debt of $6.711 billion and deferred revenue of $14.853. As we know, deferred revenue is not a true financial obligation unless one fails to deliver on goods or services owed.
This is not a perfect current situation. At the headline, the current and quick ratios stand at 0.72 and 0.61, respectively. Once adjusted for deferred revenues, these ratios rise to 1.01 and 0.85 in that order. Does that pass muster? In my opinion, just barely. Making matters worse, the short-term debt load is larger than the cash position, which will likely force the firm to refinance at least some of that debt at today's interest rates.
Total assets amount to $82.687 billion including goodwill and other intangibles of $25.028 billion. At 30% of total assets, this is not the end of the world, but it is enough to keep an eye on. Total liabilities less equity comes to $85.484 billion, which includes another $12.859 billion in deferred revenue. That's not a problem. This number also includes $17.811 billion in long-term debt.
The firm is obviously not in crisis mode, but in no way is this one of the better-looking balance sheets I've taken a look at. In fact, it's a little bit of a mess.
Wall Street
Since Dell released these earnings on Thursday night, I have come across 11 highly-rated (four-plus stars at TipRanks) sell-side analysts that have opined on DELL. Among these 11 analysts, there are nine "buy" or buy-equivalent ratings and two "hold" or hold-equivalent ratings. One of the "buys' did not set a target price, so we have just 10 of these to work with.
After allowing for changes, the average target price across the remaining 10 analysts is $144.70 with a high of $160 three times (Samik Chatterjee of JP Morgan, Asiya Merchant of Citigroup and Simon Leopold of Raymond James) and a low of $106 (Tim Long of Barclays). Once omitting one of those highs and that low, the average target across the remaining eight rises to $147.63.
My Thoughts
This was a good quarter. No way to deny that. The guidance is solid for the full year, a little lacking I thought, for the current quarter. Free cash flow has a few extra items in it. That said, the balance sheet is certainly not one of the firm's strong points. Basically, I am impressed with where the business is headed, but I am not impressed with the fundamentals. This part of the firm needs work. Bottom line? I do not have to get in on this morning's rally, but if I saw a technical set-up that caught my fancy, I could act.
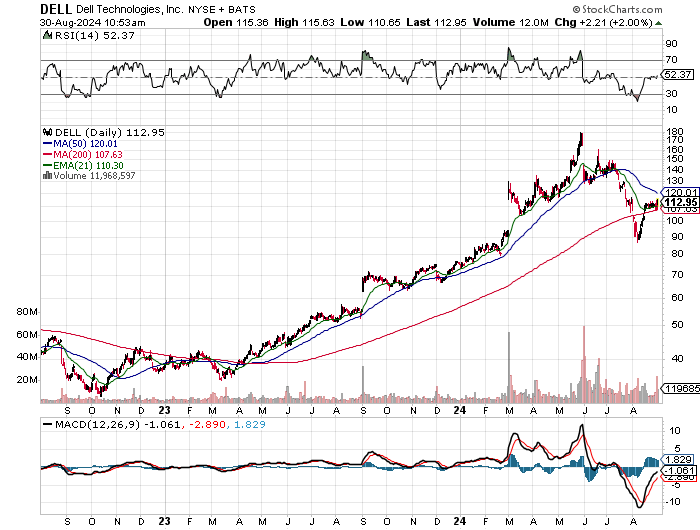
To be clear, DELL has been a great stock and rallied pretty much from late 2022 right up into later May 2024. Check this out:
Now, let's zoom in and get to work...
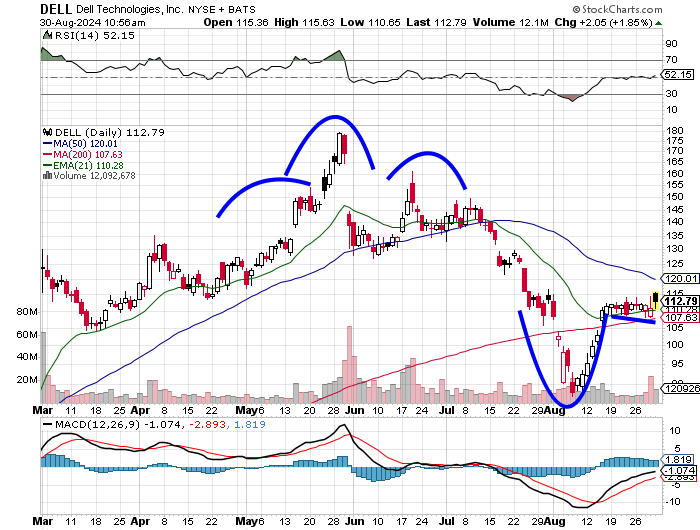
These patterns are not neat and tidy, but they do seem to be working. Readers will see a sloppy head-and-shoulders pattern that peaked in May. This was a bearish set and worked like a charm. Now, in July, into the present, the stock has developed a cup pattern with a slightly downward sloping, very shallow handle. This is probably bullish, but with almost no depth seen in the handle, I am not sure that it can be very bullish.
Relative strength is little better than neutral, while the daily MACD is looking better, but with two components still below the zero bound, it cannot be trusted. To put it bluntly, I would feel better waiting for a test of the 200-day SMA, so we know how much support there is in this setup, or simply take a pass for now and see what happens when it gets to the 50-day SMA.
A more bullish trader in this name than I might go out to November 15, 2024, expirations and purchase $120 calls for a rough $6.75, while selling the $110 puts for about $7.75. The net credit on the options trades is an even $1. Hence, if the stock trades above $120 by expiration, the trader can be long the stock at a net basis of $119. If the stock trades below $110 by expiration, the trader can be long at a net basis of $109. Lastly, if the stock stays between $110 and $120, the trader made him or herself $1.
At the time of publication, Guilfoyle had no positions in any securities mentioned.
