This S&P 500 Level Is Becoming More and More Important
It's very obvious that this particular index level matters. Here's what could happen if we break it. Plus, a look at the post-Fed market pattern, TLT, a Chinese ETF and much more.
You've reached your free article limit
You've read 0 of 1 free Pro articles.
Note: I am taking a few days off for Rosh Hashanah. The next edition of Top Stocks will be Monday evening, October 7.
The Market
Friday is Jobs Day. So the S&P 500 will probably be up. Honestly, I have no idea on the day to day but since the day after the Fed, when the S&P closed at 5713 we have essentially had an up/down market. In other words, there has only been one instance where we had back-to-back up or down days (they were up days). That’s it. Otherwise it is been every other day. So if Thursday was down, and the pattern holds, Friday should be up.
How’s that for a good analysis???
Overall, the market continues to leak but it leaks without much selling. Perhaps it’s more like a lack of buying. There is an old saying that it takes buying to push stocks up but they can fall of their own weight.
So since I truly have no idea what the jobs number will bring and which way this chop-fest will go, I want to share that there is a level on the S&P that seems to be building toward importance. I’ll round it to 5670.
I know I tend to use thick lines but let me give you some levels. That high in mid-July was 5670. I’m going to ignore those highs at 5650 in late August but if you want to include them, by all means, I wouldn’t argue.
September 20 had a low at 5674. This week, Tuesday was an intraday low of 5681. Wednesday had an intraday low of 5674. And Thursday had 5677 as the low. To me it’s pretty obvious that this is a level that is important so if we break it to the downside that will be a change.
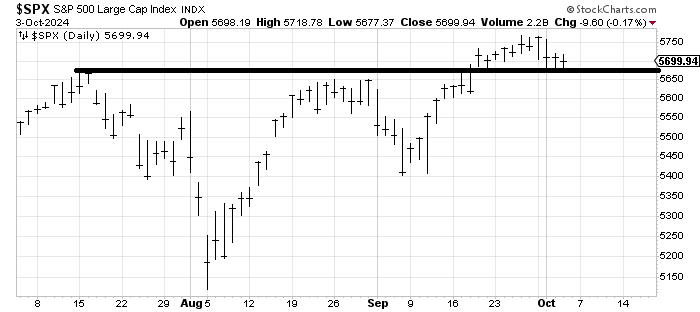
It’s not as if a break there makes the chart terrible because there is support all the way down, in layers. But it is worth noting that the Russell 2000 (which was supposed to be the big beneficiary of lower rates) is down 4% since that Fed cut (intraday) and the S&P has this 5670 area that manages to find support (for now).
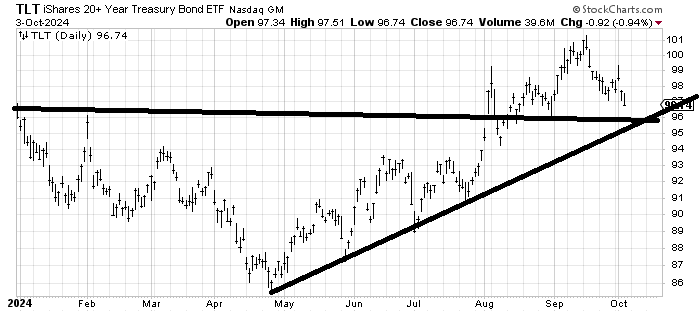
Bonds too (TLT) broke to a lower low Thursday. Rates are now higher than before the Fed. Either way, I am still thinking that $96-ish area is where TLT is headed.
New Ideas
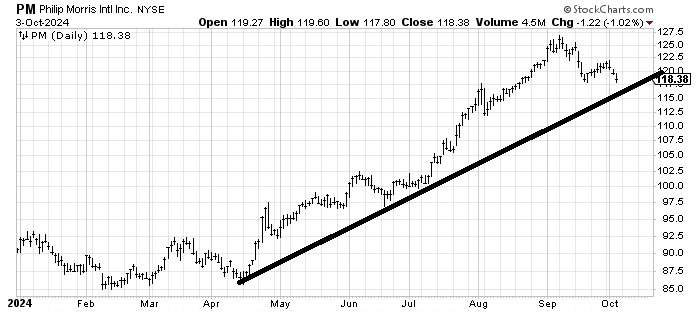
Let me start by noting that a few weeks ago I turned cautious on the "recession stocks." I will probably like them again at some point with those juicy yields some of them have. For the time being (in the very short term) I would expect Philip Morris International PM to find a bit of support around $115-ish.
I have warmed up to Exxon Mobil XOM recently and it acted well Thursday, but I would be remiss if I did not report that the DSI on oil is now 84. Energy and energy stocks could use a rest.
Today’s Indicator
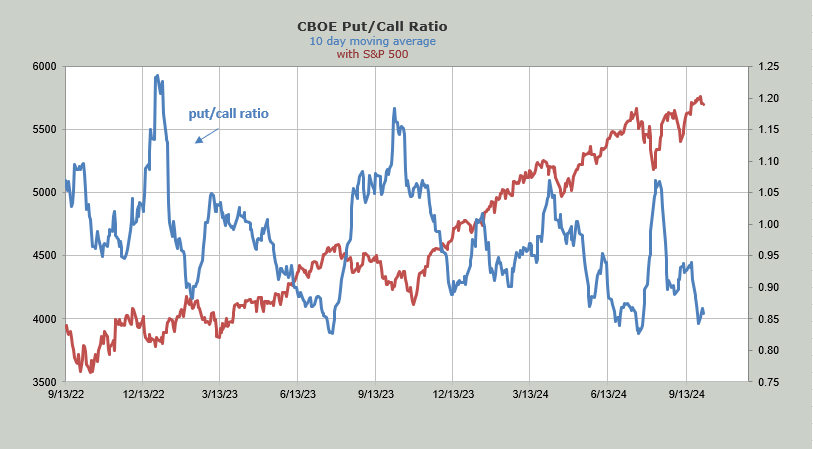
The 10-day moving average of the put/call ratio is at the low end of its range. To see a change in sentiment we’d need to see this lift.
Q&A/Reader’s Feedback
Helene welcomes your questions about Top Stocks and her charting strategy and techniques. Please send an email directly to Helene with your questions. However, please remember that TheStreet.com Top Stocks is not intended to provide personalized investment advice. Email Helene here.
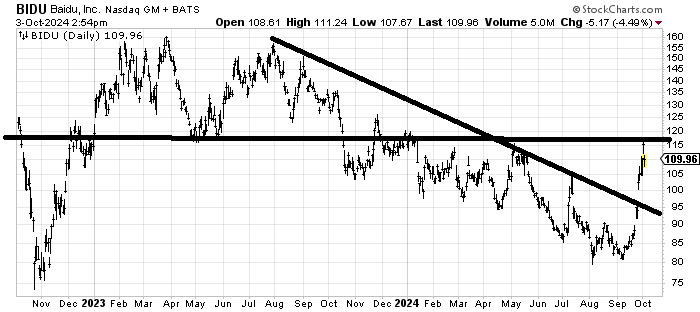
I was asked for a measured target for Baidu BIDU. Quite frankly it has lagged tremendously relative to many of the other Chinese stocks. It has a lot of resistance in this area so I would think in the near term this $115-120 area is going to be a problem. Even if it gets through you can see there is a lot of resistance to chew through. The chart would look much better if the stock pulled back or at least spent some time digesting this move and eating through that resistance.
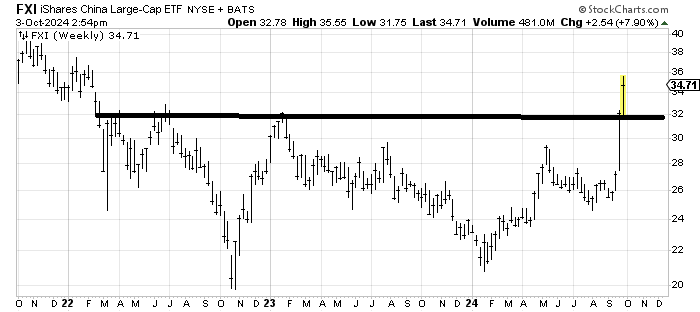
iShares China Large-Cap FXI is an ETF to be long Chinese stocks (as you know, I have been using KWEB not FXI) and I was asked for a measured target for this chart so I used a three-year weekly one. It’s a wide range but I can measure $38-42. In the near term FXI has resistance here so it really ought to pull back. If it pulls back to $32 over time it would be helpful.
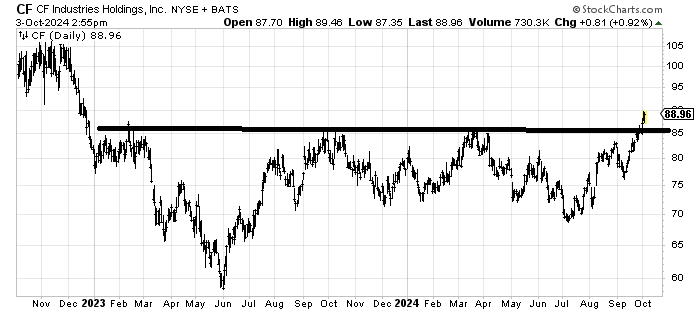
CF Industries CF has had a nice breakout from a long base. There is a lot of resistance in the $95-100 area and the base measures to $100, maybe $110. Also there is the 90/100 rule, which states that 90% of the stocks that get to $90 will make it to $100. The stock has had a big run these last few weeks so some digesting and pulling back would be helpful.
As a reminder, I warmed up to Nutrien NTR (also a fertilizer stock) a few days ago.
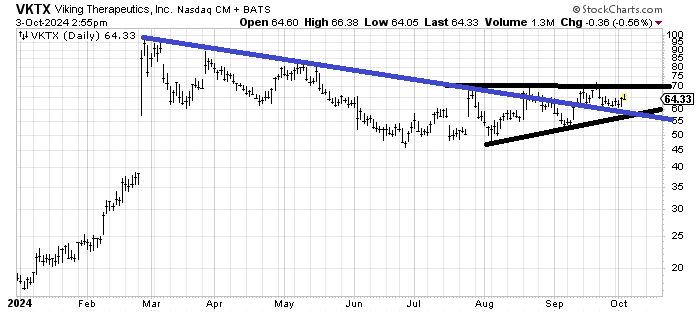
Viking Therapeutics VKTX has been going sideways for months. I would love to see another dip down to $60-ish to give it more time and get the market back to an oversold condition and if it held $60 that would be bullish. In other words, the risk/reward at $60 is pretty good.
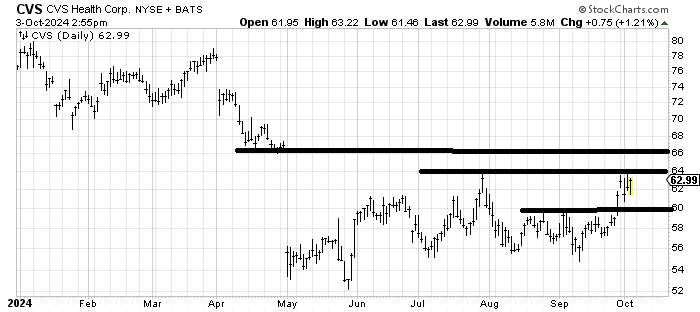
CVS Health CVS should fill the gap at $66 but with the activist announcement last week the dynamics of the chart might change. For the time being on a pure chart basis I’d start with a gap fill at $66.