The SOX Parties Like It's 1999, While Breadth Shows Only Controversy
In this market, nothing compares to semiconductor stocks.
You've reached your free article limit
You've read 0 of 1 free Pro articles.

The Market
As I go through the charts, there is something that strikes me almost daily: there are so many charts that are not or have not participated in the rally. Oh, maybe they had an enjoyable week or two coming off the lows, but for the last two weeks, there has been more drooping and dripping while the SOX parties like it’s 1999.
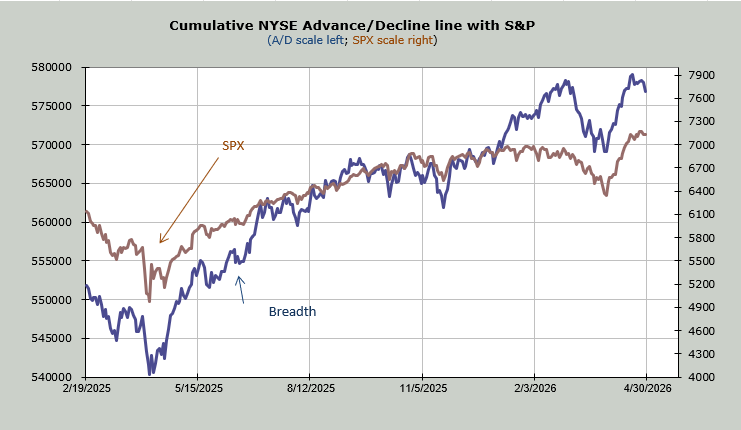
That’s the number of stocks making new highs contracting. That’s the breadth contracting. And yes, breadth is not terrible, not like it was in 2021, but you can see it (blue line) on the chart: it has rolled over while the S&P has sat here for a week or more.
The Russell 2000 came oh so close to filling the gap up on April 17th, so that’s given it all back. So have the Midcaps. We already know the banks have lagged. We know the industrials have lagged. So have the drugs and staples. And today the metals took a hit.
Sentiment, up through late last week, was knocking on the door of giddy, but with action like this, we are not going to get anyone to get more bullish. The ten-day moving average of the put/call ratio fell from 1.01 to .80 and it has now turned back up.
The Investors’ Intelligence bulls only picked up one point this week. They now stand at 50%, and the ratio of bulls to bears is now 2.37.
But back to breadth. The McClellan Summation stopped going up today. Nasdaq’s stopped yesterday. The NYSE now needs a net differential of +1000 advancers minus decliners to halt the decline.
Then there are bonds which just keep dripping lower (yields up). There is nothing dire there yet, but it’s starting to bother me. The good news is the DSI is 25, so if yields rise much more, the DSI will fall into the ‘bullish’ side.
And oil. My pick on this run up was Halliburton (HAL), and that’s done fine, but for all of you who asked me today: how can the market ignore the move in oil, I say to you, look at all those stocks that have been dripping and leaking, look at the give back in the Russell and Midcaps, Banks and Industrials. Look at the Dow, which hasn’t made a higher high and has been red for five straight days. The market sees higher rates and higher oil quite clearly. It’s the S&P and Nasdaq that don’t. Oil’s DSI is 85.
Is it a Wall of Worry or is it a case of whistling past the graveyard? I suppose it depends which camp you are in. And with those indicators rolling over, I am thinking of moving to the ‘graveyard’ if this keeps up.
There is one indicator I’ve got my eye on again, though, that is moving toward the bullish end of the spectrum. It’s early, but the put/call ratio for the Russell has been quite high for the last week. It’s incredibly thinly traded, so I won’t fuss too much, but the ratio is moving up, and that’s the same thing it did throughout much of March.
New Ideas
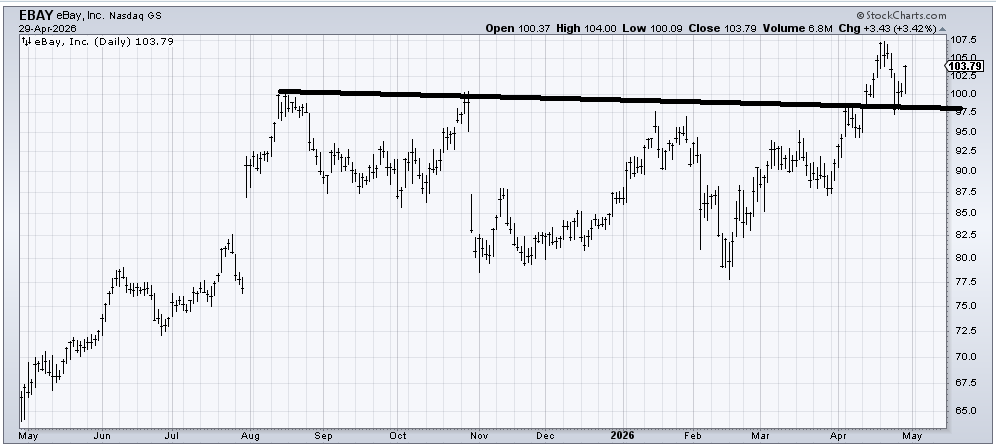
I recommended eBay (EBAY) a few weeks ago, and it has done well, considering it’s not a semiconductor stock! Any trip back under 97 and I would get out.
Today’s Indicator
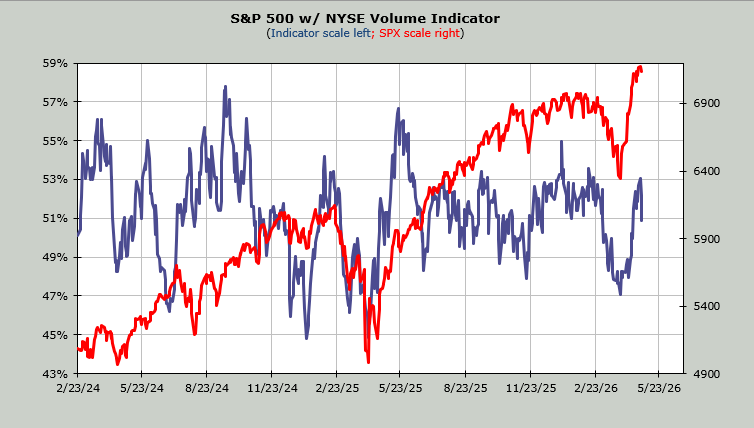
The Volume Indicator is at 50%, down from 53% on Monday. It ought to lift one more time. Let’s see if it can.
Q&A/Reader’s Feedback
Helene welcomes your questions about Top Stocks and her charting strategy and techniques. Please send an email directly to Helene with your questions. However, please remember that TheStreet.com Top Stocks is not intended to provide personalized investment advice. Email Helene here.
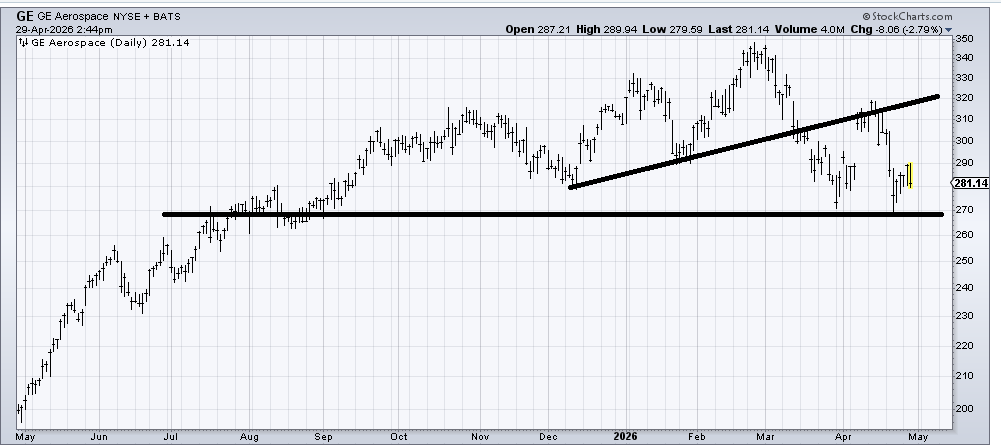
I don’t love the chart of GE Aerospace (GE) because it has made lower highs for a few months now. It would still have to break 270 for this to be a top of some magnitude, so I’d watch for that. Does it hold or break that area?
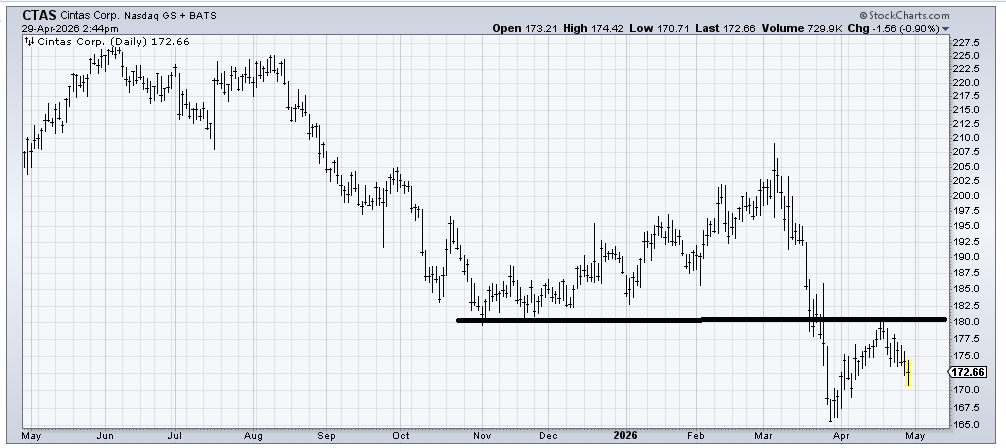
Cintas (CTAS) would get more interesting if it can hold above/at this recent low (around 165). My issue is that there is no base to speak of, so for now, holding down there would just be for a trade in my view.
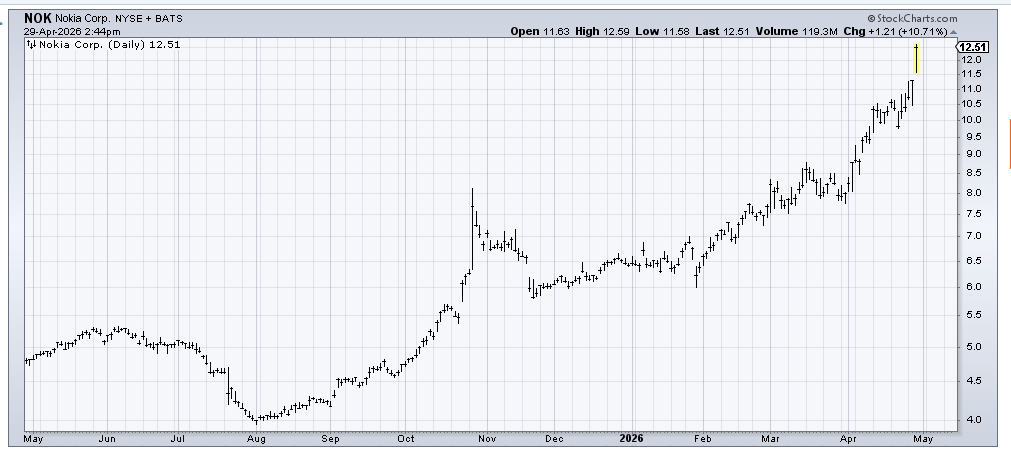
Nokia (NOK) has been terrific, but I would not chase it. That’s just not my style. I’d call it a hold with a trailing stop. Be careful if it gaps down under 11.50.
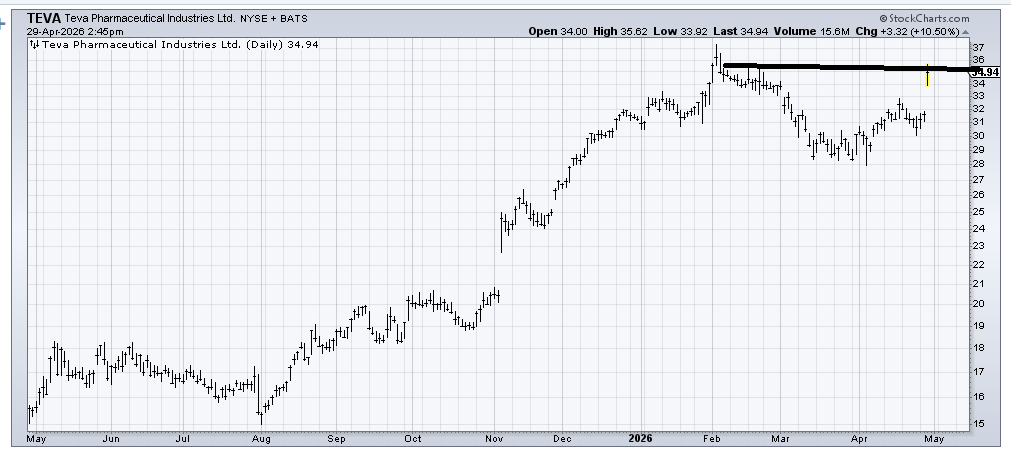
I can’t chase Teva (TEVA) up here, but if it can digest these gains for a few days without tumbling a lot, then I think it can rally again and finally get up and over resistance, so the next few days are important. Even a move back to fill the gap would not be a big positive to me because then it will look like a failure.
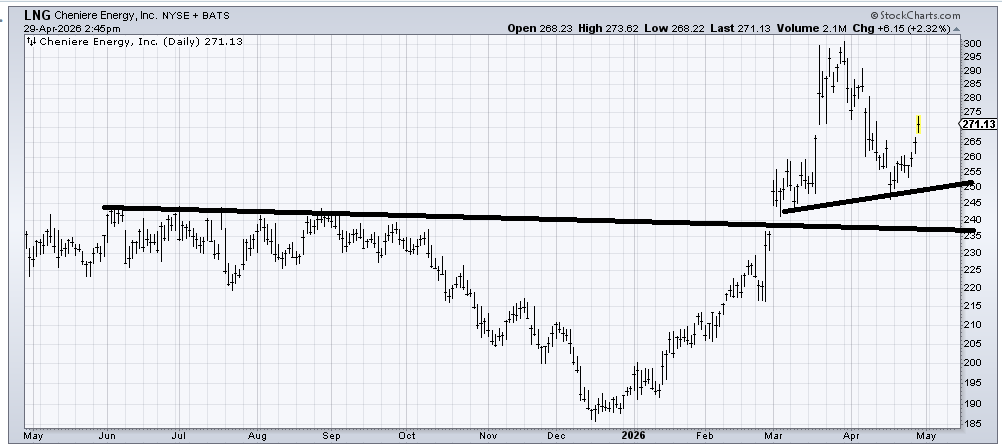
Back near the lows, I liked the chart of Cheniere Energy (LNG) , and it hasn’t done much wrong since. It’s hard for me to chase it up here, so I’ll call it a hold as long as it stays over that 250 area.
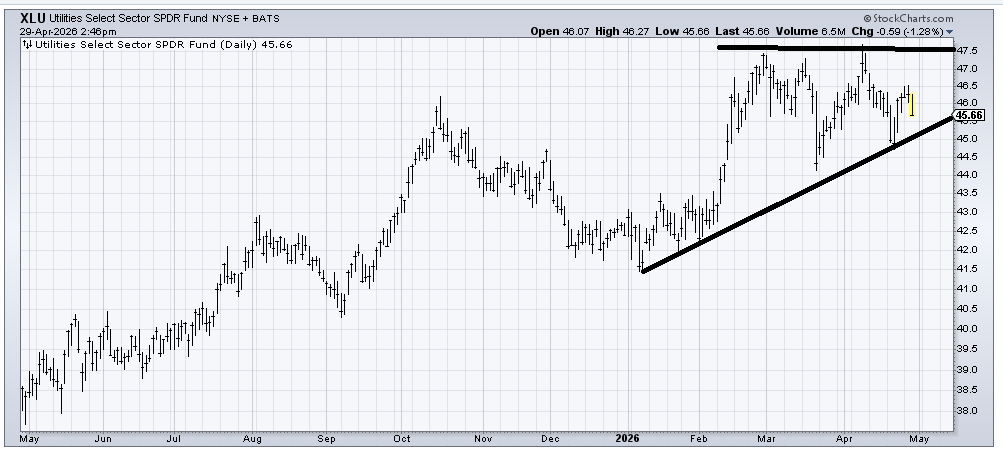
(XLU) is one of the more bothersome charts to me. It hasn’t made a lower low since mid-March, but it threatens to do so. Breaking that uptrend line would be bearish.
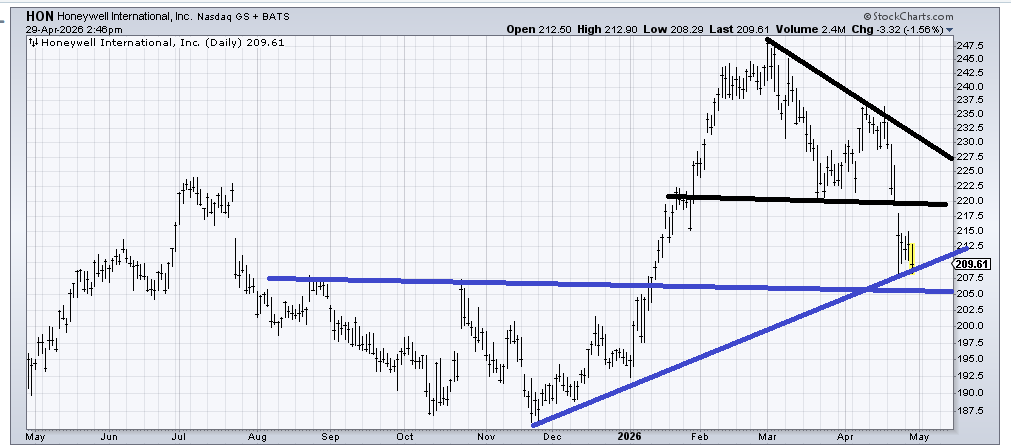
I had thought Honeywell (HON) would be buyable into a pullback when asked about it in February. You can see it rallied and then died. I don’t like that. There is some very good support in this area (blue lines). I would look for it to start stabilizing in this area. But that breakdown at 220 is a negative.
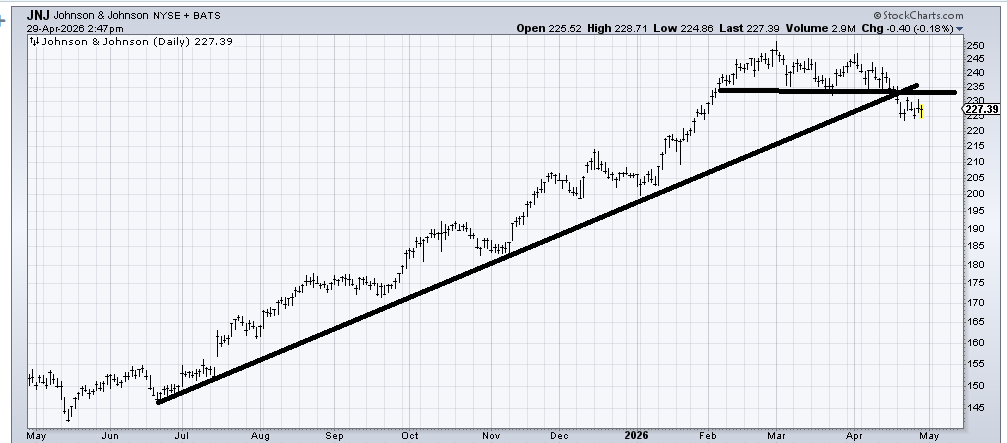
I am still not a fan of Johnson and Johnson (JNJ) . It doesn’t have a big top –it’s just a small one now, but it has left a lot of resistance in that 235-240 area, so I would only get interested in it again if it can get back up over 235-240.
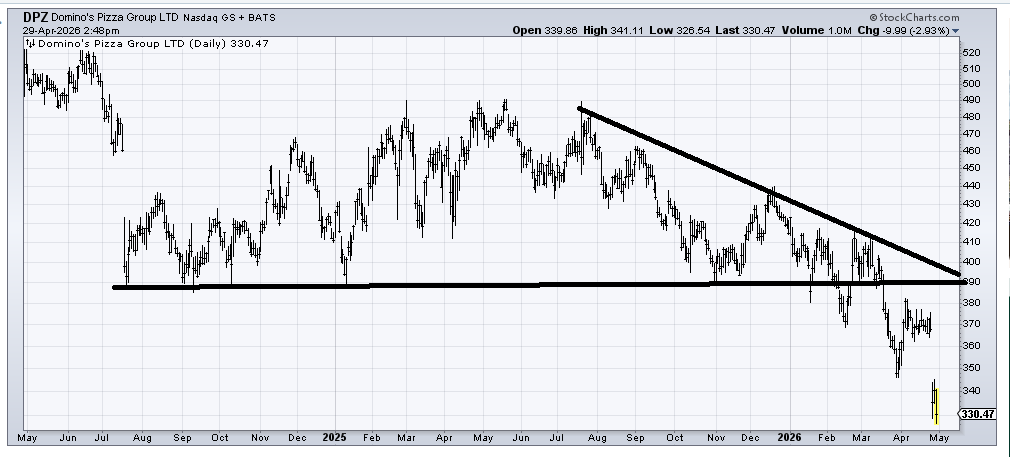
Domino’s Pizza (DPZ) broke down from a big top, so you’re trying to catch a falling knife down here. That top measures to around 290, so I would say let it settle, let it find a low, let it develop into a bottom.