The SOX Are Off the Floor, but the Breadth Is Still Bad
The QQQs and SOX may be driving the stocks higher, but most stocks aren't going along for the ride. Plus LRCX, PANW, JNJ, LNG, BBY, and SNOW.
You've reached your free article limit
You've read 0 of 1 free Pro articles.
The Market
That is now three straight days for the QQQs and the SOX. I do believe they can rally further but after today there are some resistance levels to look at.
But first, let me point out that at the lows today, which did not break but came to similar levels as Friday, we saw fewer stocks making new lows on the NYSE and Nasdaq. The Russell did make a lower low. That is a minor positive divergence.
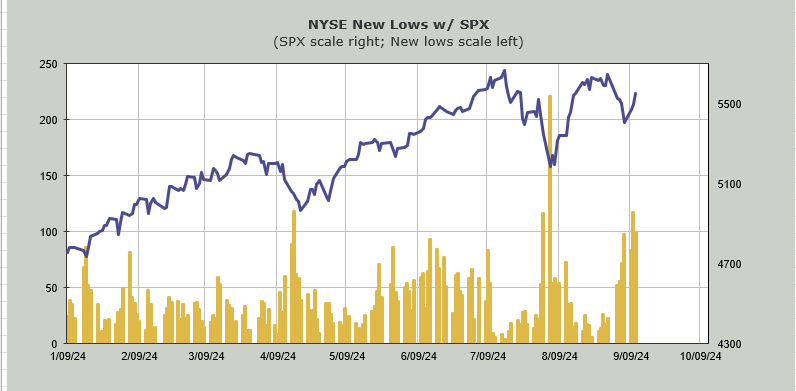
And we’re into that time frame I discussed earlier this week for an oversold rally. Please keep in mind, I still think we’re looking at a short-term rally. If the rally keeps up for a few more days we’ll be back to overbought again late next week.
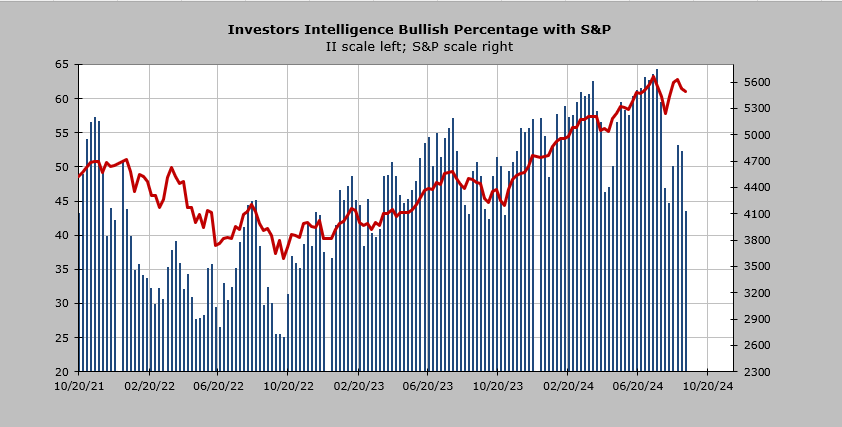
But there was a real change in the sentiment this morning, prior to the reversal. The Investors Intelligence bulls dropped nine points to 43.5%. That is a smidge lower than the 44.6% we saw after August’s decline.
The curious thing is that this 42-43% area for the bulls has not been breached in more than a year. The last time we got under 40% for the bears was February 2023. The bottom line is sentiment shifted in this survey, and that is ultimately a positive for the market.
What was awful about today? Breadth. Yet again, we see when the SOX and the QQQs lead a rally they tend to do so at the expense of almost everything else. Net breadth on the NYSE was +400. Monday was +870 and I was complaining about that!
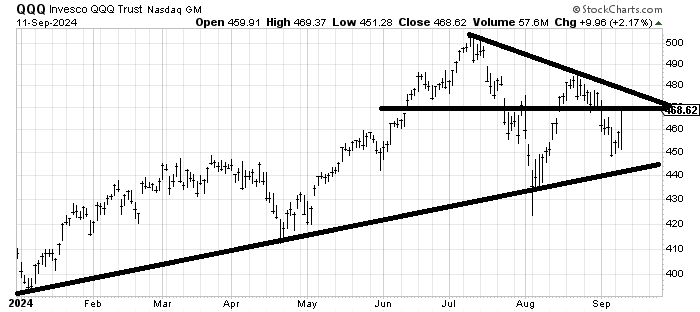
For now, I think this 470-475 area will be some resistance for the QQQs. A few days of pullback and/or chop and another rally next week seems plausible. I suspect the volatility is not yet over, so don’t fall in love with your stocks.
New Ideas
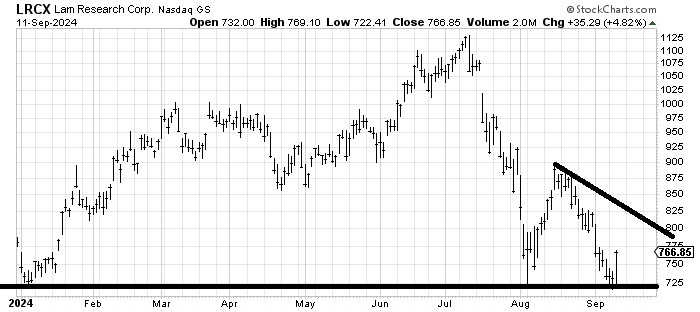
The question, now that Lam Research LRCX finally rallied, is how far can it go? I have been eyeing the 800-825 area. There is light resistance at 800 and the downtrend line, by the end of next week, shows up just over 800.
Today’s Indicator
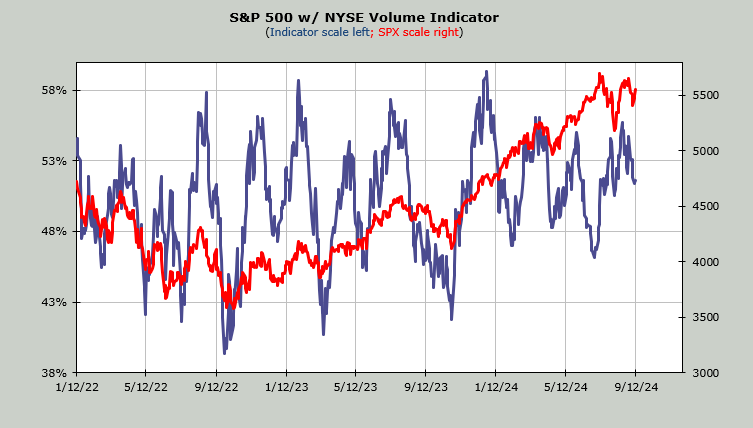
The Volume Indicator is at 51% which is not oversold.
Q&A/Reader’s Feedback
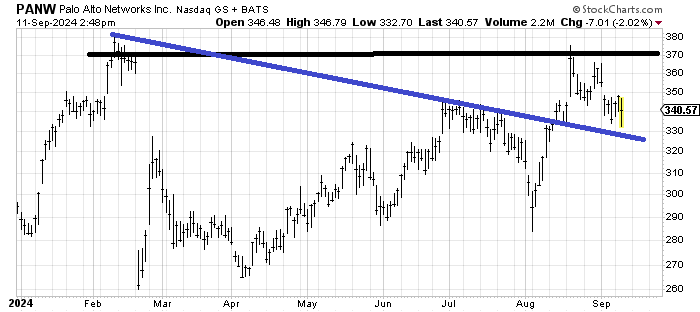
I recommended Palo Alto PANW in April when it retested the February low. The target was always the gap fill which took its sweet time and did not fill until August. I don’t love the chart now but I would look for a bounce, especially if it came down and tagged that blue line.
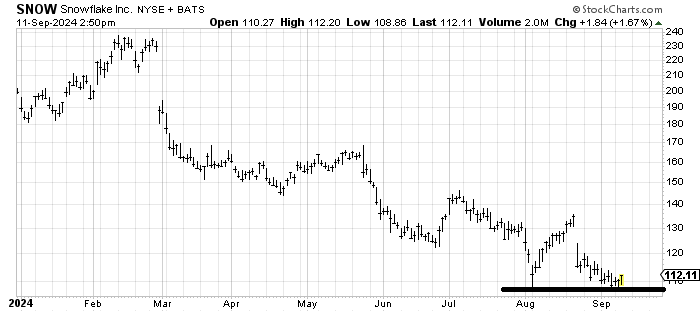
Snowflake SNOW should bounce from this retest but if it turns south and breaks this low around 110, I’d be out of the stock in a hurry. Also, this is a candidate for tax loss selling so treat it as a trade for now.
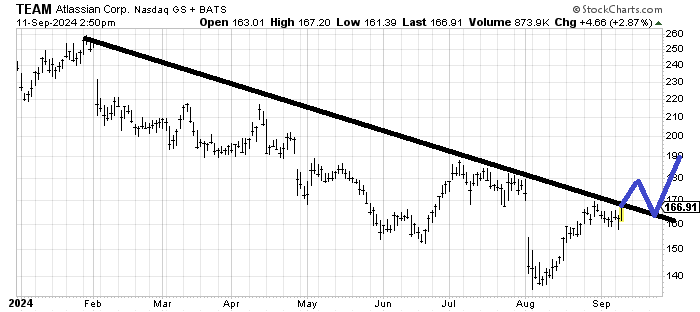
Atlassian TEAM should fill that gap around 170-ish but it is hard to get excited because it has resistance all the way up over 180. I do, however like that it has not come down to the early August low. If it can map out as I have drawn in blue, I would start viewing the chart as a potential base.
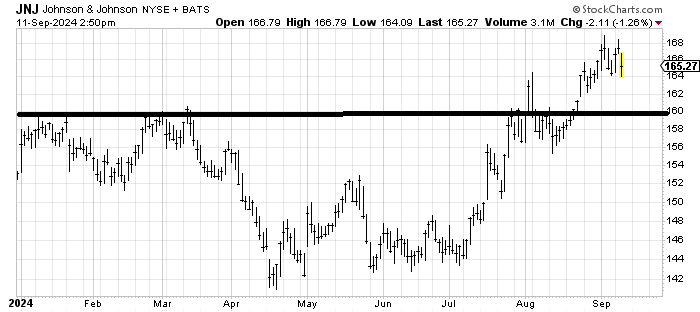
Johnson and Johnson JNJ has a measured target near 180. For the time being, though, I think it needs some sideways action or a trip to retest 160-ish.
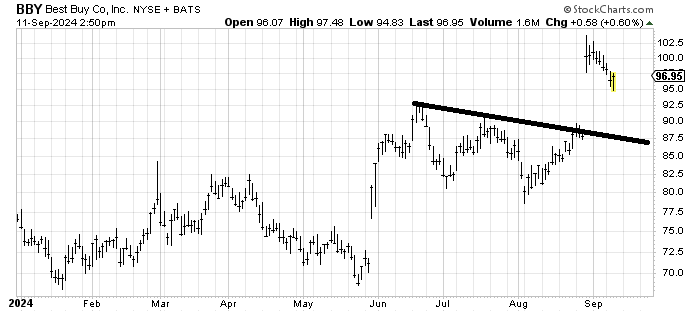
Best Buy BBY is a stock we looked at a few months ago with an upside-measured target of 100. It has achieved that, so now the best it can do is go sideways. If it fills the gap near 88-90 in the next few weeks, I might like it for a trade; otherwise, I would err on the side of profit taking.
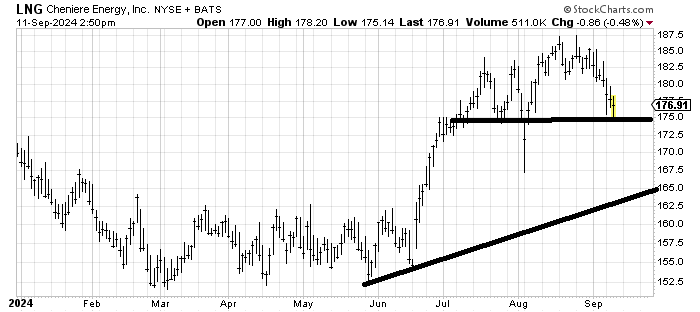
Cheniere Energy LNG looks like it is trying to roll over and so while it may hold 175 I am inclined to be a seller for the time being. It feels as though it could/should rally and then break to come down and tag the lower line.