The Charts of LVMH Look Lackluster
Tiffany owner sags in premarket trading after sales miss.
You've reached your free article limit
You've read 0 of 1 free Pro articles.
I wrote about LVMH Moet Hennessy Louis Vuitton ADR LVMUY on July 15, noting that "Traders and investors should avoid the long side of LVMUY but if you need a new luxury car you might check out some of the deals out there."
Prices in France for LVMH are down about 3.8% Wednesday and they made a new low for the move down on the charts after the firm posted disappointing revenue results. They shares are down in premarket trading in the U.S., too.
This drop for the luxury name comes as second-quarter sales fell short of analysts’ expectations. Revenue landed at $45.2 billion in the first half of they year, down 1%. Second quarter revenue was up 1% year-over-year at $22.7 billion, but both numbers landed below expectations.
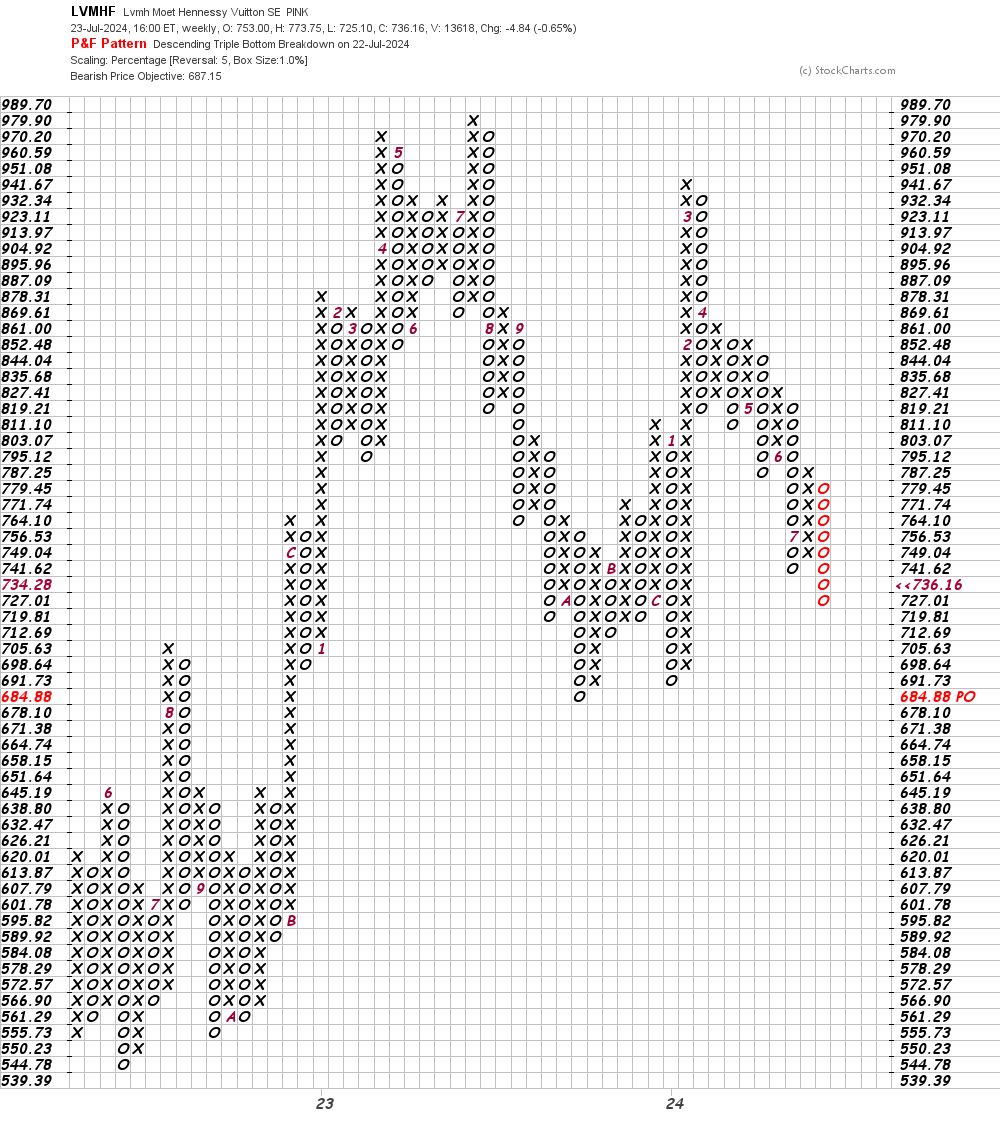
I only want to show one chart.
In this weekly Point and Figure chart of LVMHF, below, I used a five box reversal filter. In this chart the software shows a price target in the $687 area. The key point is that if prices break the $684 area they are likely to precipitate further declines.
Bottom line strategy: Keep your powder dry.
Employees of TheStreet are prohibited from trading individual securities.