Is the Door Open for a Silver Trading Encore?
Recent softness in precious metals could lead to a fresh opportunity.
You've reached your free article limit
You've read 0 of 1 free Pro articles.
Earlier this year, we entered a successful long trade in silver. Recent softness in commodities in general, and in metals in particular, could be opening the door for a trading encore.
To get a grasp on the pullback in commodities, let’s look at the chart of the Invesco DB Commodity Index Tracking Fund DBC. This bellwether commodity fund, of which 12% is invested in precious metals and 14% in base metals, has lost about 6% during the month of July.
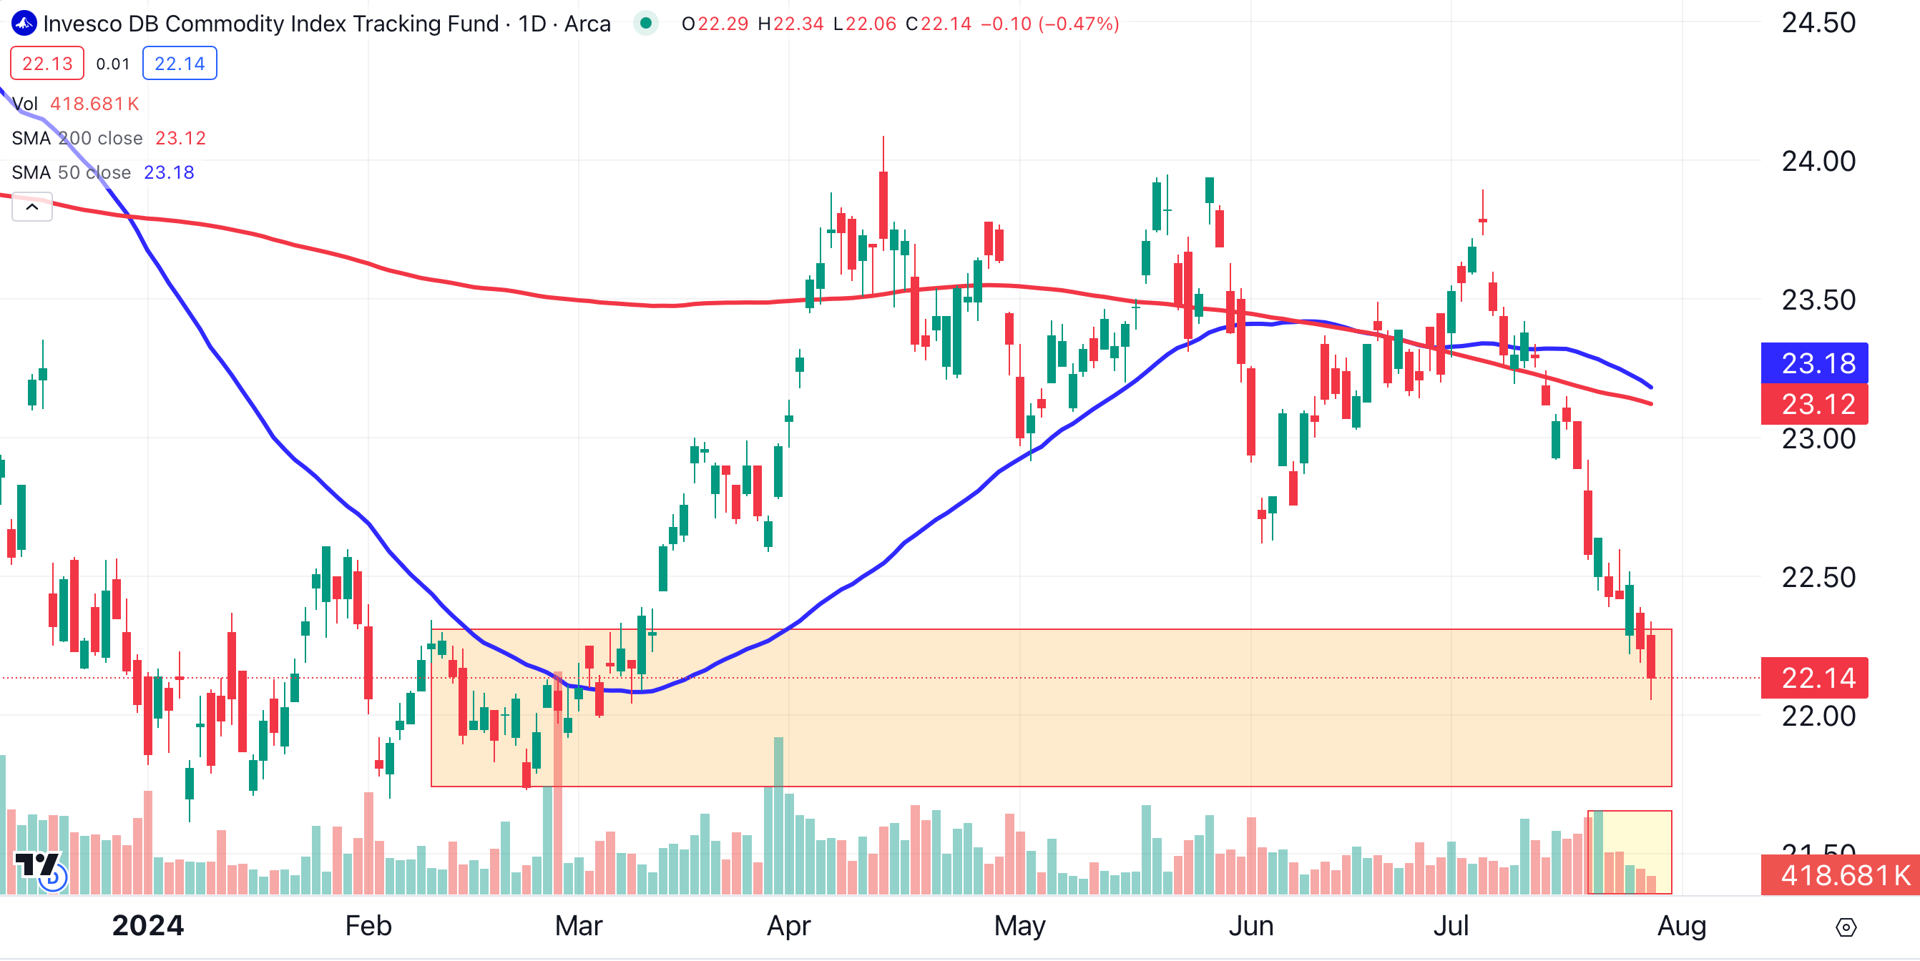
One thing immediately stands out on this chart: DBC’s volume has been steadily waning over the past week (shaded yellow). This could be an indication that the pullback in commodities has just about run its course.
While DBC currently trades below its 50-day moving average (blue) and its 200-day moving average (red), its price has fallen into an area of broad demand (shaded orange). This is another sign that the recent bout of softness in commodities may be nearing an end.
Regarding metals, recently we’ve seen pullbacks in everything from copper to palladium. Why does silver stand out among this group? First let’s take the long view by visiting silver’s weekly chart.
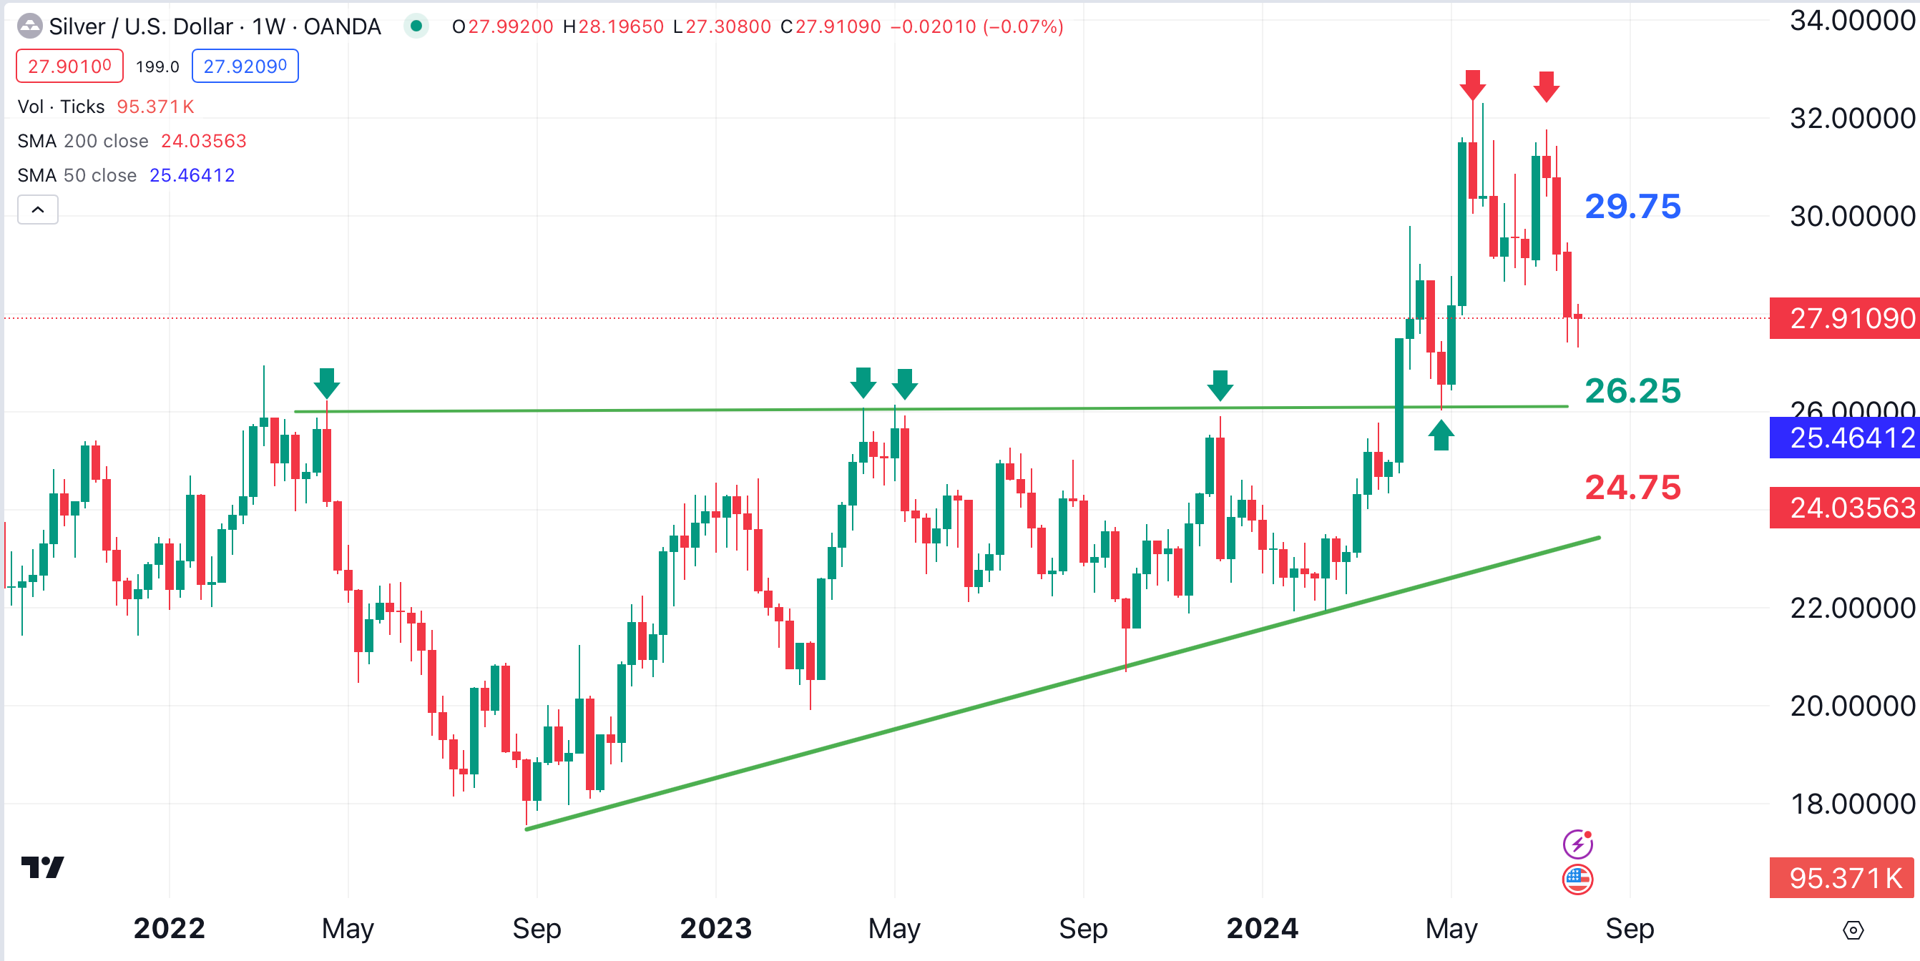
Silver struggled for two years to break resistance (down green arrows), located in the area just above $26. The breakout finally occurred in April, and silver subsequently pulled back to that area of resistance, which now acts as support (up green arrow).
This pullback provided the entry for our previous silver trade. Subsequently, silver rocketed above $30.
As silver approached $32, it encountered fierce resistance. A second attempt to breach that level also failed. The two failed attempts (red arrows) formed a double top, a bearish technical pattern. That pattern suggests a return to the $26 area.
Zooming in to the daily chart, we can see silver’s 200-day moving average (red), currently located at $25.89, rising to add an additional layer of support.
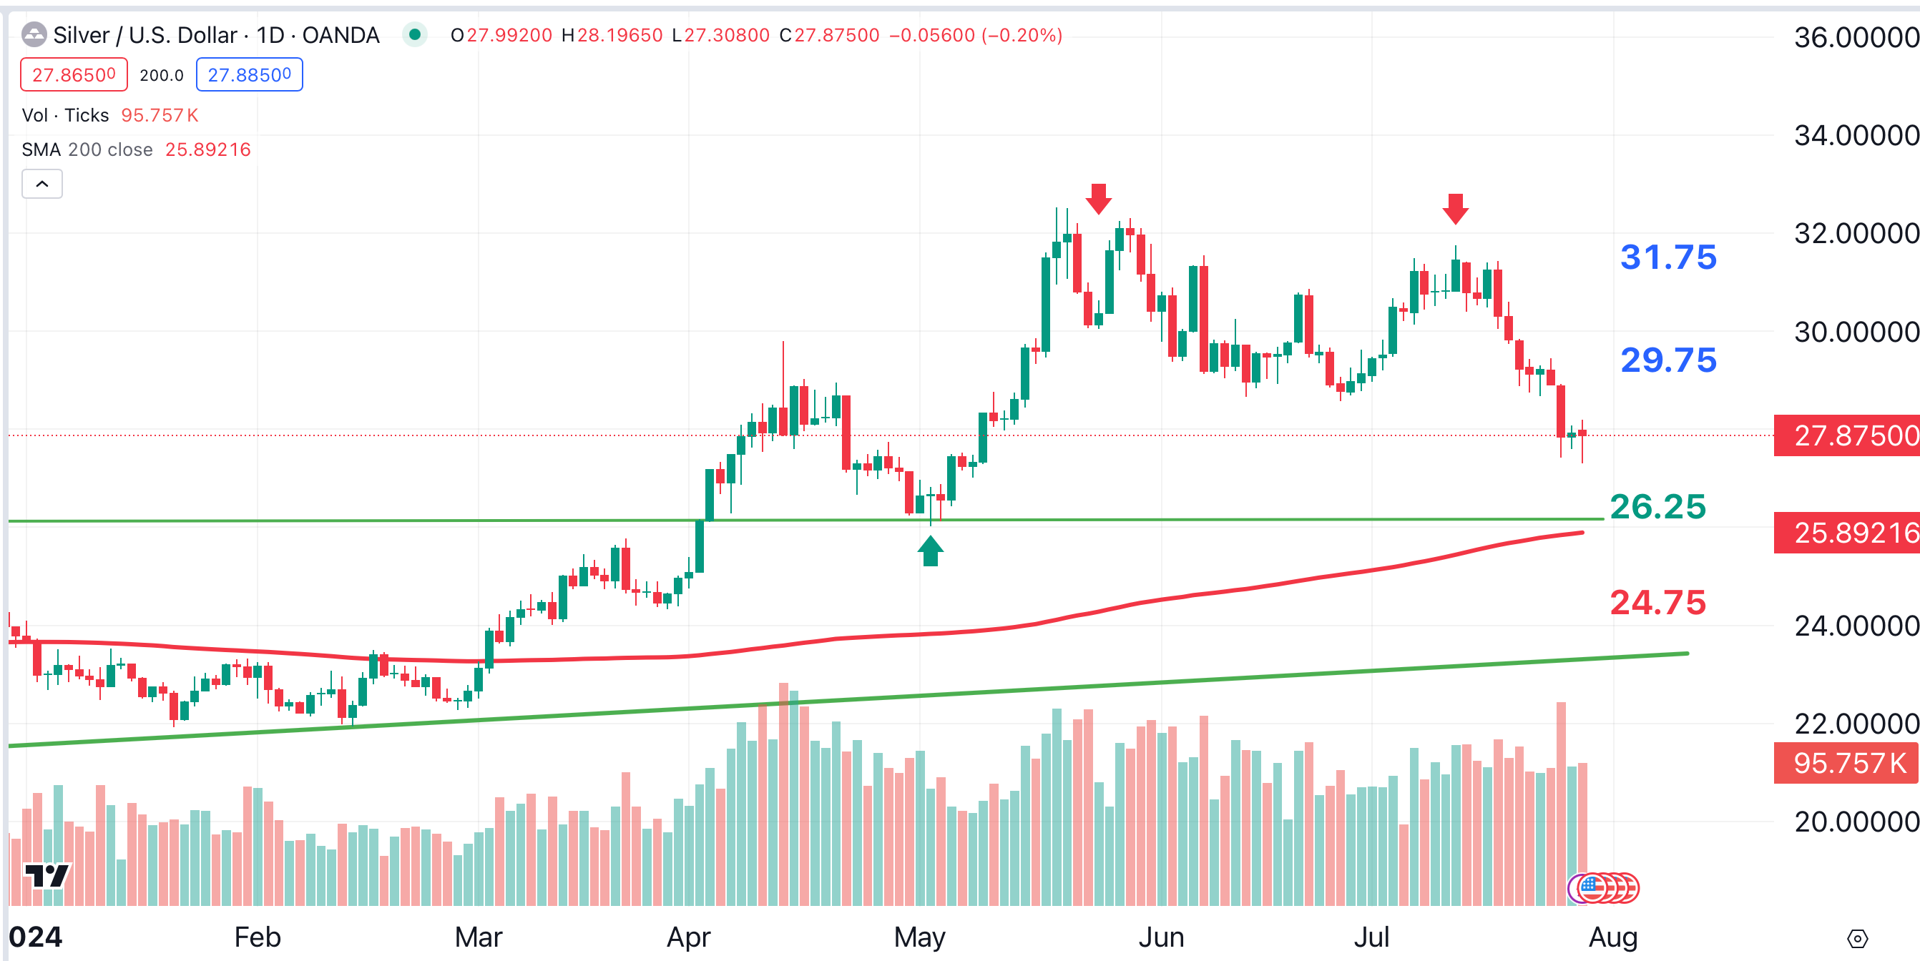
While this new trade setup is similar in some ways to our previous silver setup, there are a few differences. We’re sticking with an entry at $26.25 (green), as that figure still makes sense from a technical standpoint.
Our stop at $24.75 (red) will take us out of the trade if the price breaks both support (green line) and silver’s 200-day moving average.
This time around, our targets are slightly less aggressive. We’re gunning for a return to resistance at $31.75 (blue) as our ultimate target. We’ll use $29.75 (blue) as a preliminary target. If the preliminary target is reached, we’ll close half the overall position and raise our protective stop.
At the time of publication, Ponsi had no positions in any securities mentioned.