Should We Use the Weakness in Neurocrine Biosciences to Buy It?
Let's first go over the charts and indicators.
You've reached your free article limit
You've read 0 of 1 free Pro articles.
Biotech firm Neurocrine Biosciences NBIX has a portfolio that includes FDA-approved treatments for "tardive dyskinesia, chorea associated with Huntington's disease, endometriosis and uterine fibroids and a robust pipeline."
Let's check out the charts.
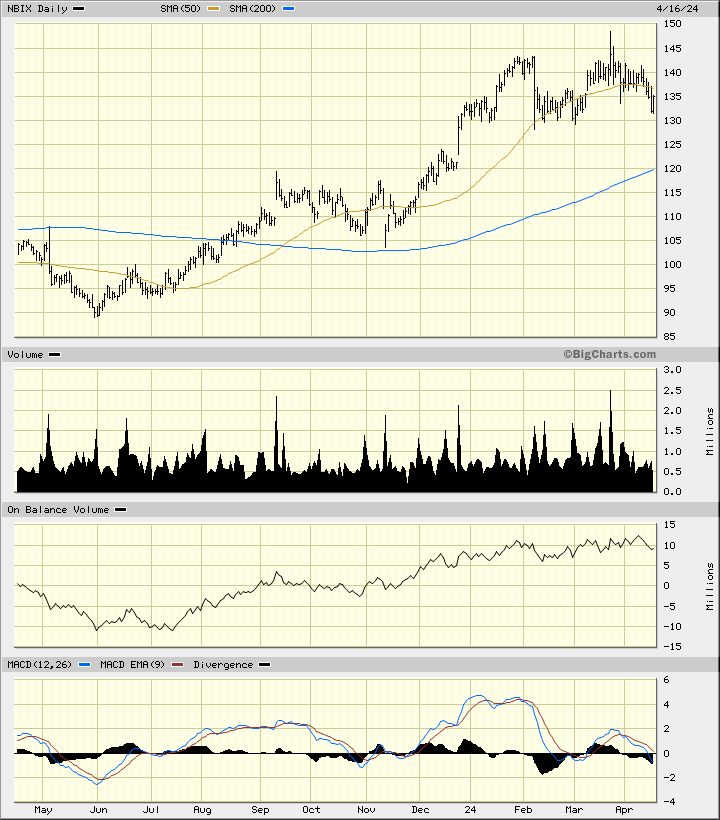
In this daily bar chart of NBIX, below, I can see that prices have turned sideways in the $130-$145 area. NBIX trades below the declining 50-day moving average line but above the rising 200-day line.
Trading volume has been more active since November and the On-Balance-Volume (OBV) line shows us a positive pattern since July. The Moving Average Convergence Divergence (MACD) oscillator is weak and close to an outright sell signal.
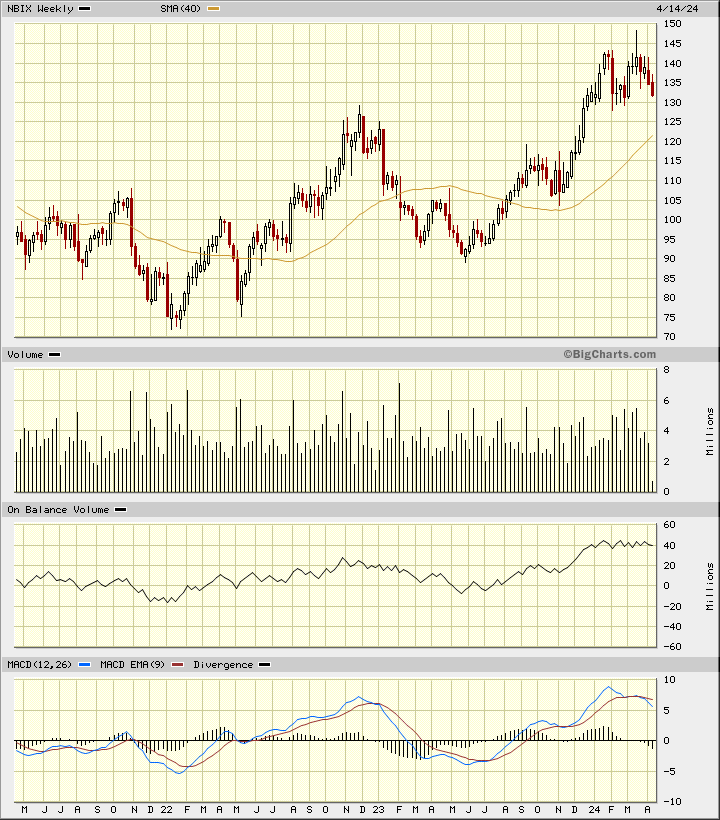
In this weekly Japanese candlestick chart of NBIX, below, I can see that prices are pulling back to the $130 area. In February I can see a number of lower shadows around $130 to suggest that traders may again reject moves down to that level.
The weekly OBV line has remained steady while the MACD oscillator has weakened.
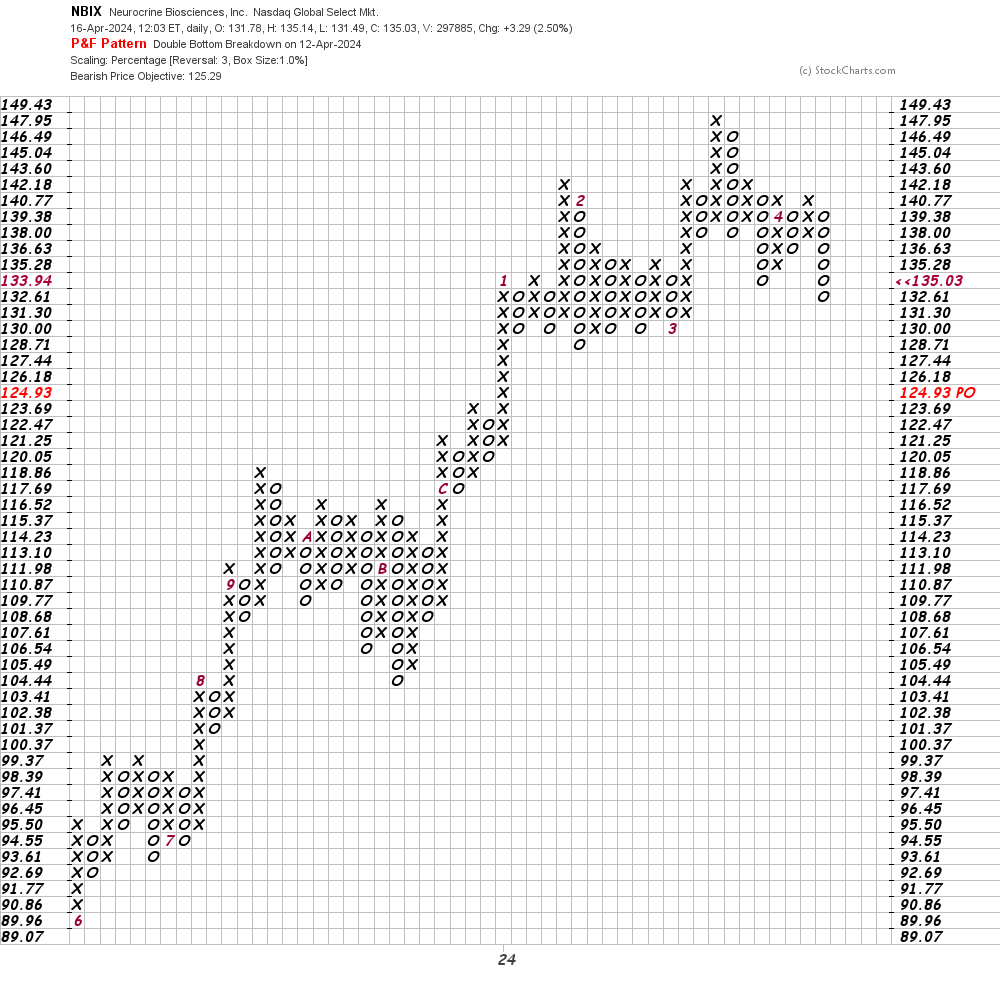
In this daily Point and Figure chart of NBIX, below, I can see a downside price target in the $125 area.
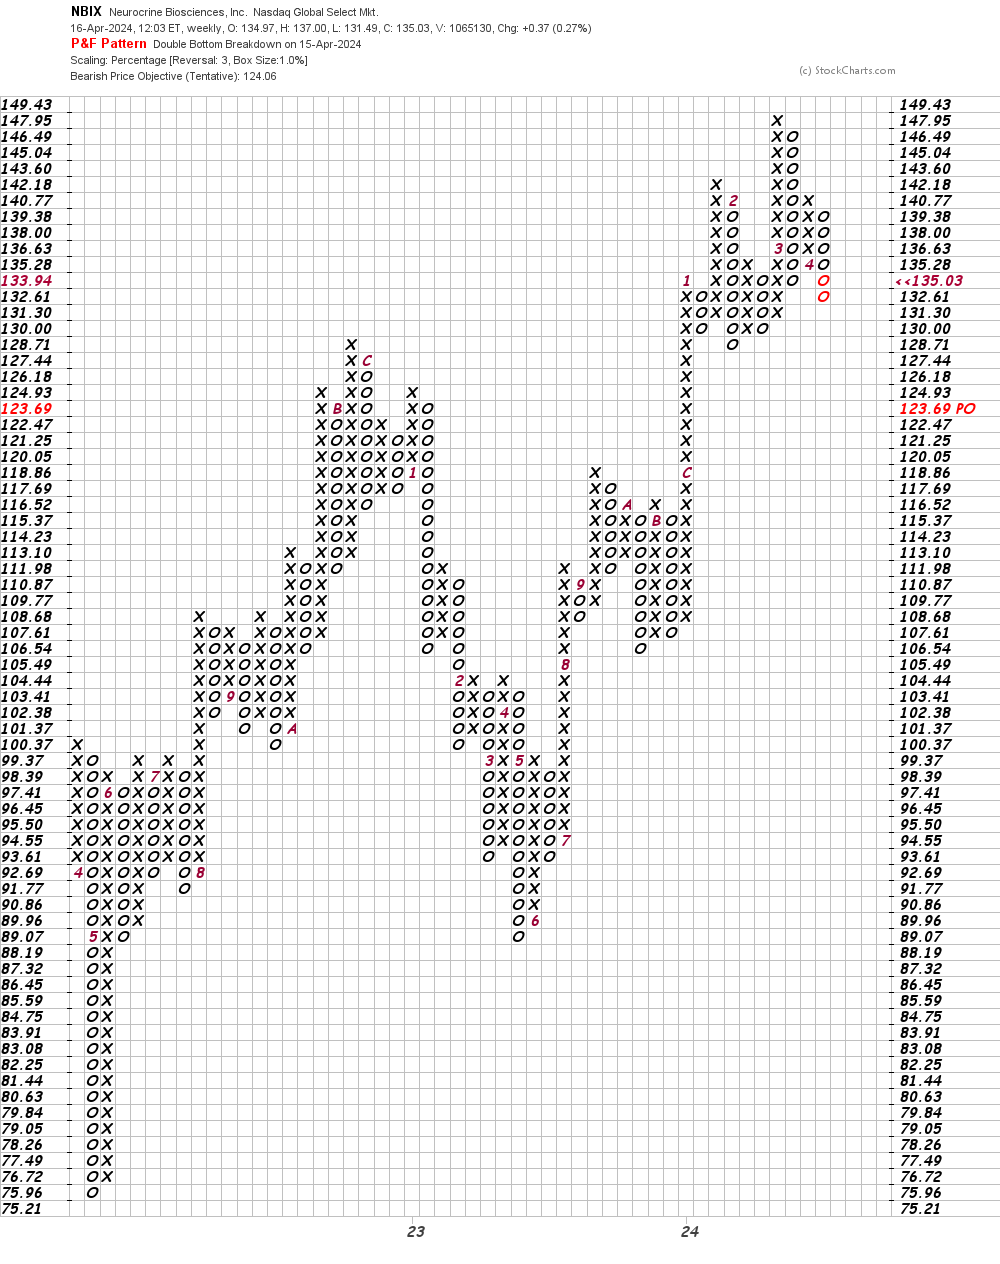
In this weekly Point and Figure chart of NBIX, below, I can see a price target in the $124 area.
Bottom line strategy: Weakness in the broad market averages keeps me cautious about new purchases and adding to existing positions. If NBIX holds the $130 area in the weeks ahead we will have plenty of time to get long.
Employees of TheStreet are prohibited from trading individual securities.