S&P 500 at New Highs, Breadth at New Lows — What Now?
Bad breadth continues, as semis go too far and bonds hold up after PPI. Plus a healthcare stock acting like a semi and a metal I'm warming up to.
You've reached your free article limit
You've read 0 of 1 free Pro articles.

The Market
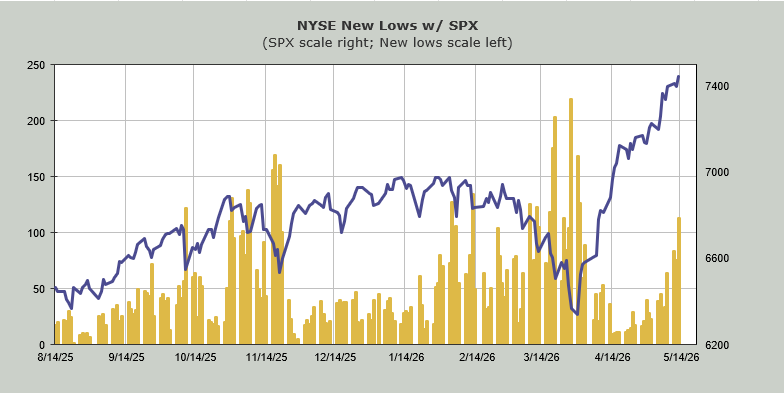
By now you probably know that breadth was terrible Wednesday. By now you probably know that both the NYSE and Nasdaq had the most stocks making new lows since late March.
We’ve been looking at the Nasdaq new lows (they numbered 232 Wednesday, so just over 40 more than we had Tuesday — and let me remind you Wednesday was an up day for Nasdaq) so let’s look at the NYSE lows.
The NYSE new lows jumped up to 113 Wednesday. That too is the most since late March. Keep in mind that while the Nasdaq had nearly 600 new lows at the peak reading in March, the NYSE had just over 200, so 113 is high, especially on a day the S&P 500 has made a new high.
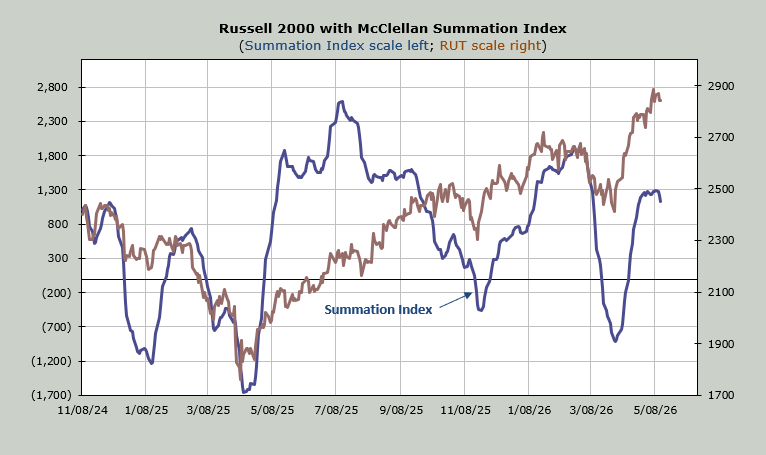
The weak breadth has finally rolled the McClellan Summation Index over enough that you can see it. It will now require a net differential of +1,600 advancers minus decliners on the NYSE to halt the decline.
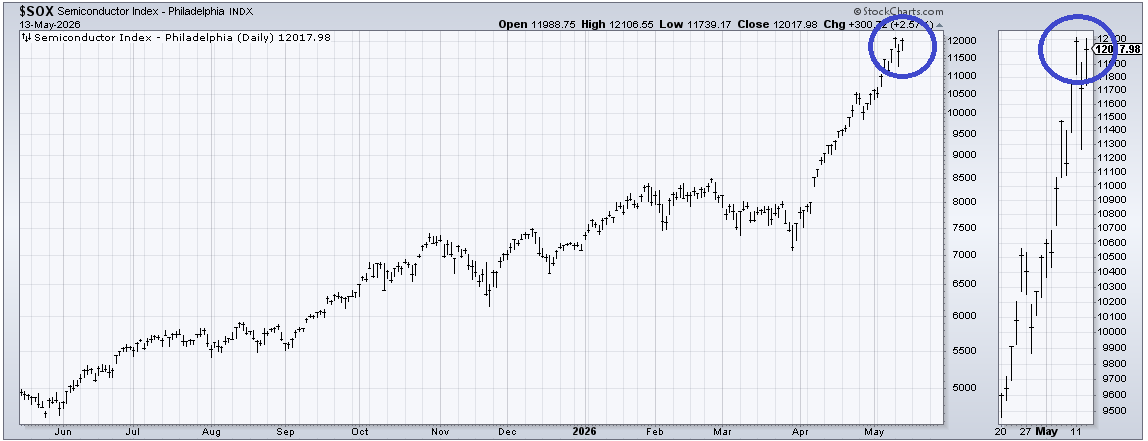
As you know by now I think the move in the SOX has gone too far and is in need of a correction, but to me that is the worst we can say about this move. The trouble is everyone sees the same "gone too far." But I noticed something Wednesday: the SOX did not make a higher high. It’s very minor but it seems worth watching.
Finally, the bonds act poorly. We’ve discussed this several times in the last two weeks. But here’s what I have my eye on when it comes to the bonds: The inflation print (PPI) Wednesday morning was red hot and quite frankly the move in interest rates was relatively mild considering Tuesday’s CPI and Wednesday’s PPI.
I am not ready to buy bonds yet ( (TLT) still hasn’t filled the gap and the DSI is not low enough) but let’s see if the fact that bonds didn’t collapse on that hot PPI number matters in the days ahead.
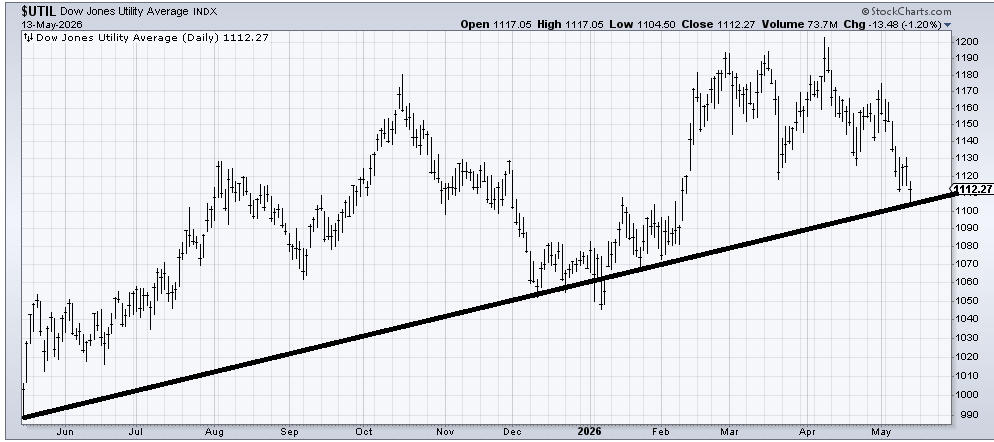
And the Utes broke Wednesday. No one — and I mean no one — seemed to notice or care. I want a bit of hysteria because they really are at support and getting awfully oversold in the short term.
New Ideas
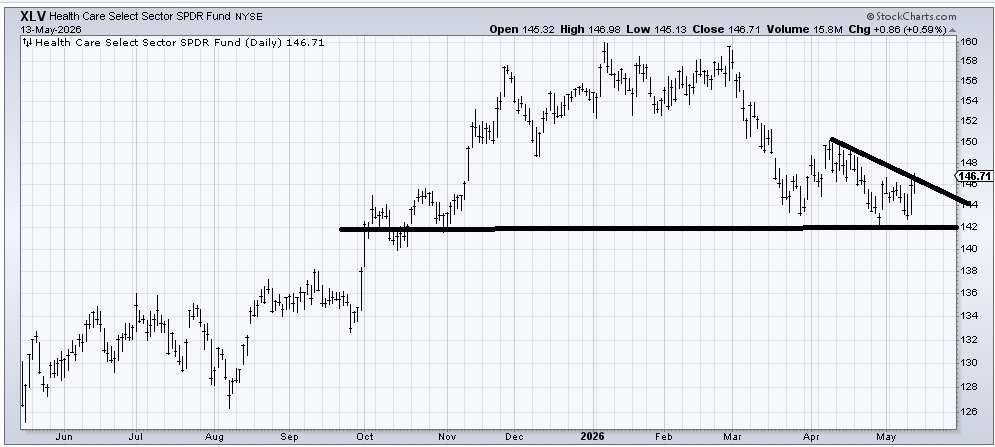
I want to follow up on State Street Health Care Select Sector SPDR ETF (XLV) , which someone asked about maybe a week or so ago. I said at the time I thought another dip would get me more interested. It’s starting to develop a small — very small — bottoming pattern. Crossing this $147-ish area should make XLV a better chart.
Today’s Indicator
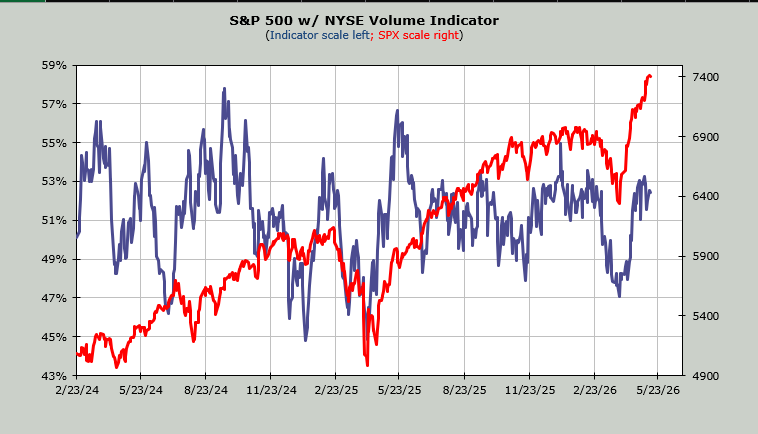
The Volume Indicator has been so weak it hasn’t been able to get to 55%. It got as high as 53% before heading down.
Q&A/Reader’s Feedback
Helene welcomes your questions about Top Stocks and her charting strategy and techniques. Please send an email directly to Helene with your questions. However, please remember that TheStreet.com Top Stocks is not intended to provide personalized investment advice. Email Helene here.
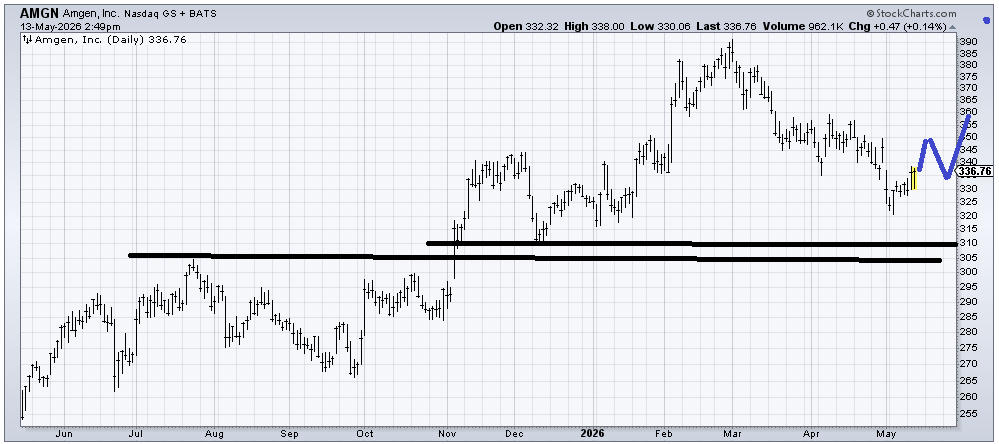
I am hesitant to fall in love with Amgen (AMGN) here because of the resistance not far overhead. The support is not far away so this $310-330 area is probably the right price, but you might have to sit with it a long time before it improves. For example, it probably plays out something akin to how I’ve drawn in blue. I’d buy it with a big dose of patience.
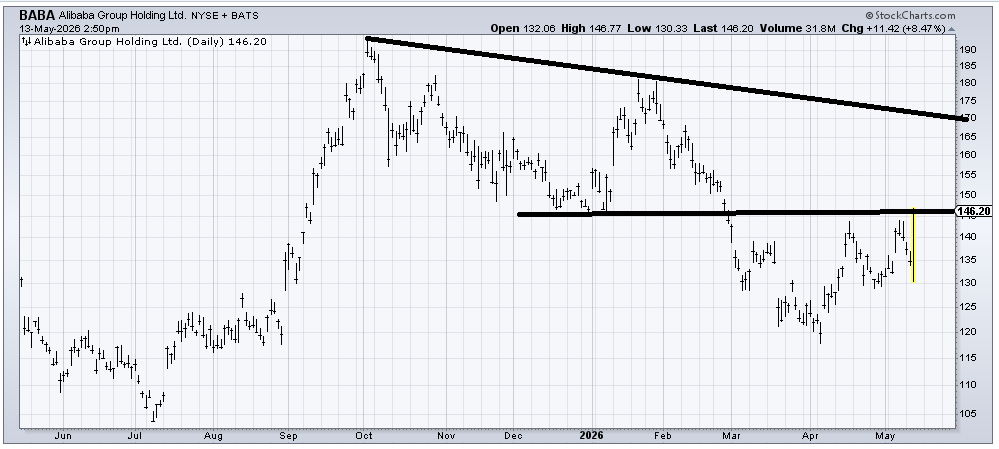
I have been waiting for Alibaba (BABA) to move and while it has had a terrific move Wednesday all it’s done is plow right into resistance. I will continue to wait for it to cross that resistance in the upper $140s.
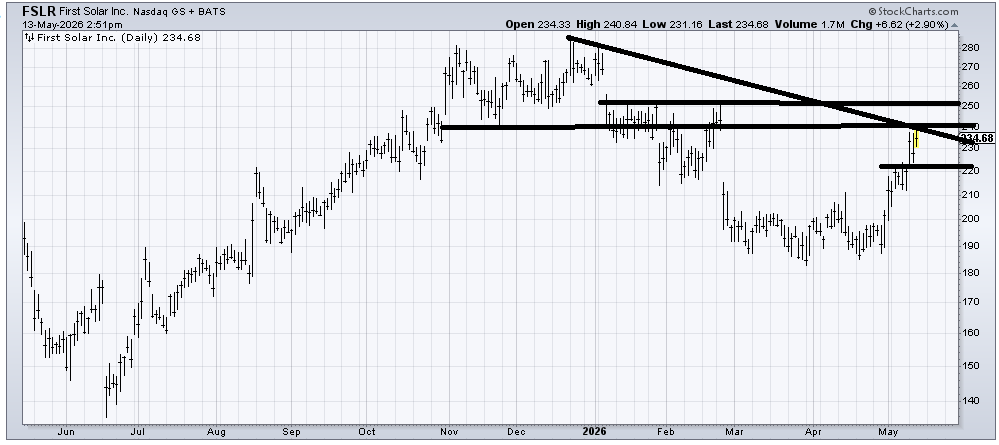
First Solar (FSLR) has a lot of resistance to eat through but since I thought it was a sale in in January (it did come down 20%) I would now think it is improving. A pullback to $220 would be helpful and should be buyable.
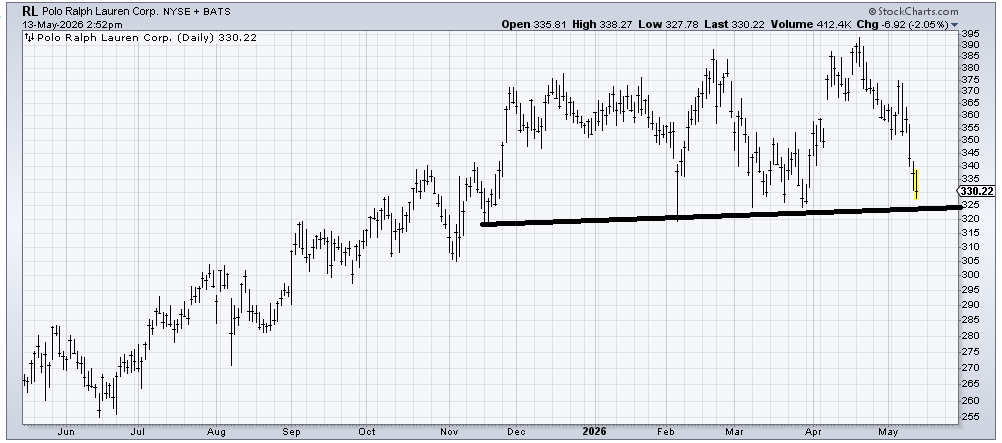
Ralph Lauren (RL) is definitely getting oversold in the short term, but if it breaks down that is going to leave a top behind. I would say that you can buy it down here for a trade (short-term oversold rally) but with earnings next week, you run a great risk that it gaps down under that line.
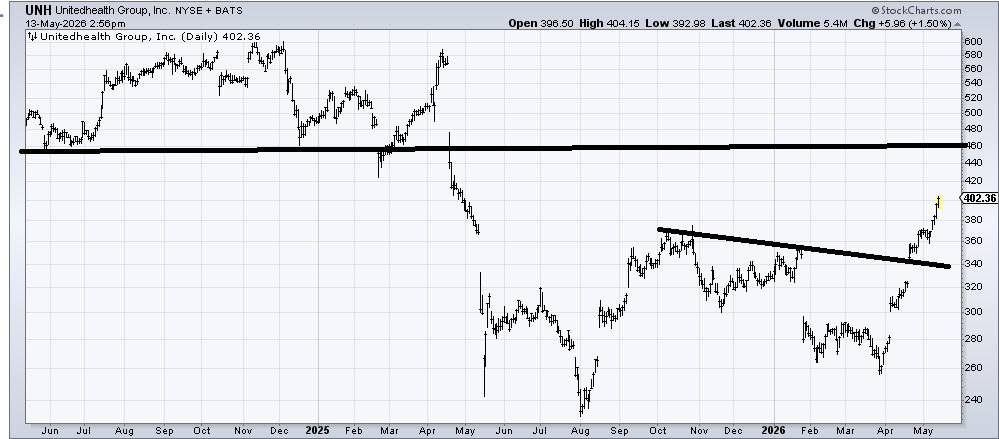
Way back in February when UnitedHealth (UNH) was $272 I said I thought it was buyable. It was quite a terrible call for two months but since the low it's acted like a semiconductor stock! It is over-extended in the near term but the measured target is in the $460 area.
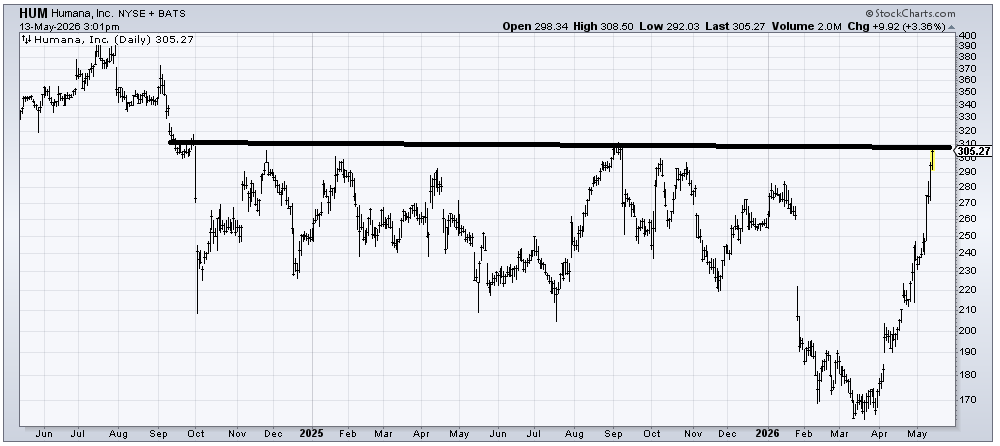
Humana's (HUM) big breakdown in February seems to have been a false one. And the stock did not even stop at the gap fill at $260, which is impressive. However, I cannot in good conscience say the stock is buyable right here at resistance. Should the stock back and fill into the $280 area I might take a look at it there. If I had a choice in healthcare I’d choose AMGN over HUM right now.
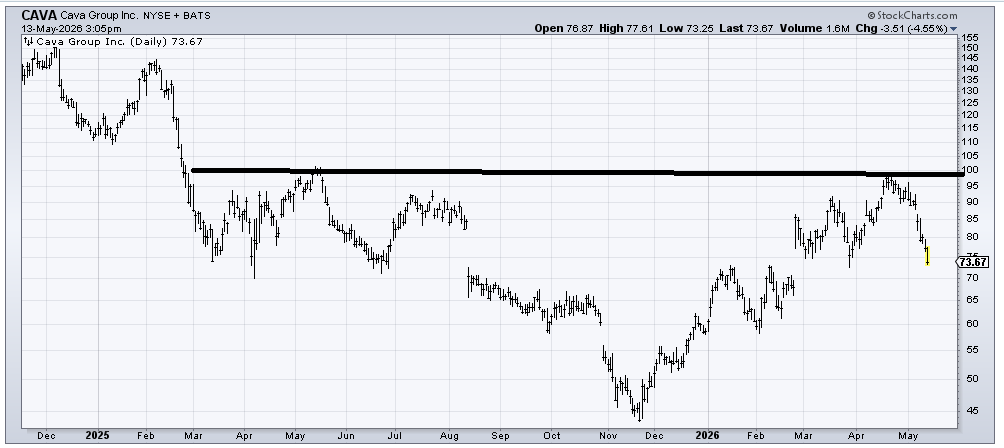
Cava (CAVA) has earnings next week so be careful. It is a consumer-facing stock and we’ve discussed how the consumer-facing stocks have been terrible. In the short term I call it a coin toss, but I went with a longer-term chart because if the stock can stay over $70-ish after earnings this might turn into a head-and-shoulders bottom.
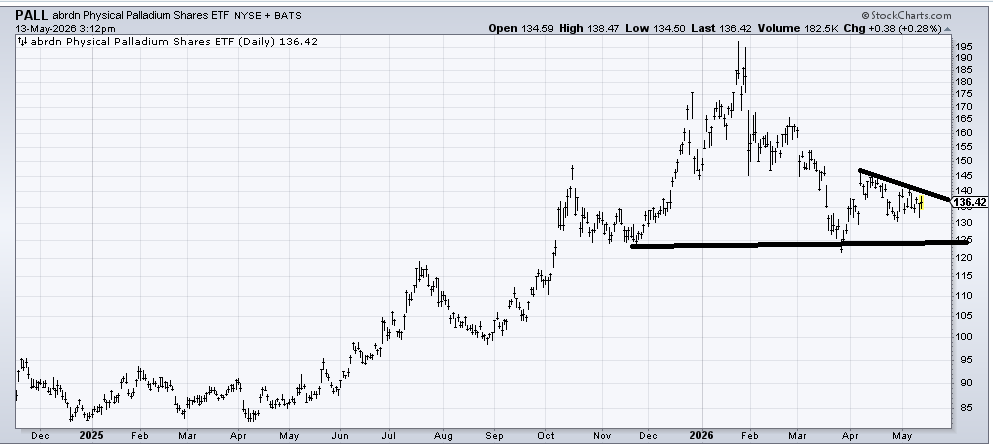
While I have warmed up to State Street SPDR S&P Metals & Mining ETF (XME) lately I have not warmed to abrdn Physical Palladium Shares (PALL) , an ETF to be long palladium. But perhaps I ought to. I’d use a stop under $130. Under $125 would be terrible. But crossing $140 would be a plus. So consider me warming up to this.
Related: As Treasury Yields Signal Danger Ahead, Keep 3 Tips in Mind
