Rocket Lab's Charts Should Soon Defy Gravity
Here's why this spacecraft and satellite play appears to be a rising star.
You've reached your free article limit
You've read 0 of 1 free Pro articles.
Rocket Lab USA Inc. RKLB is a supplier of flight-proven satellites, subsystems and spacecraft components. It's also a favorite topic of TheStreet Pro's Stephen "Sarge" Guilfoyle. The stock rallied earlier this month on record quarterly revenue. Let's check out the charts and indicators.
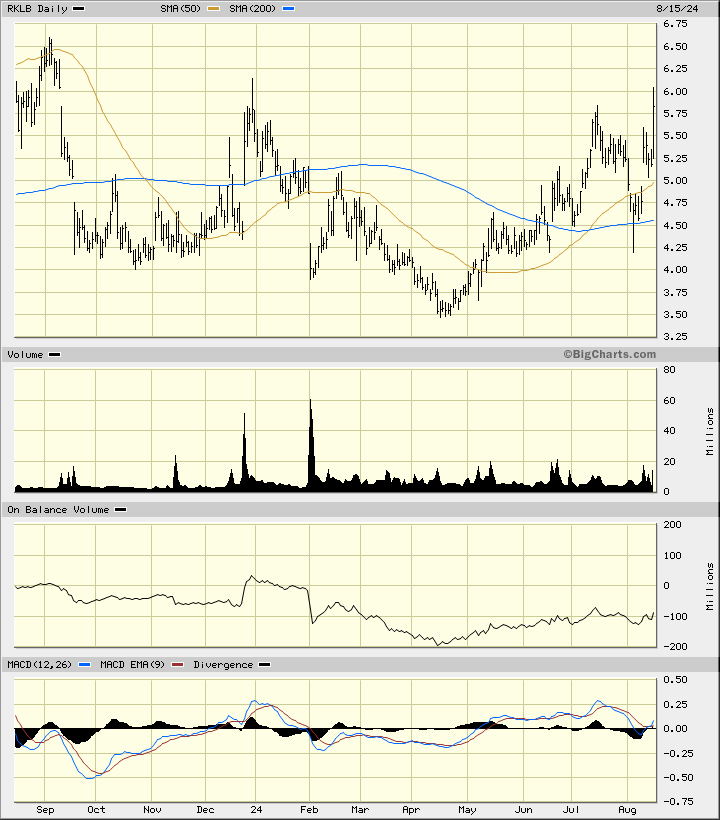
In this daily bar chart of RKLB, below, I can see the last 12 months of daily price action. Prices have made a bottom pattern. RKLB now trades above the rising 50-day moving average line and the rising 200-day moving average line. The On-Balance-Volume (OBV) line shows us improvement since the middle of April telling me that buyers of RKLB have been more aggressive than sellers.
The Moving Average Convergence Divergence (MACD) oscillator is turning upwards after a dip to the zero-line. This is a fresh outright-buy signal.
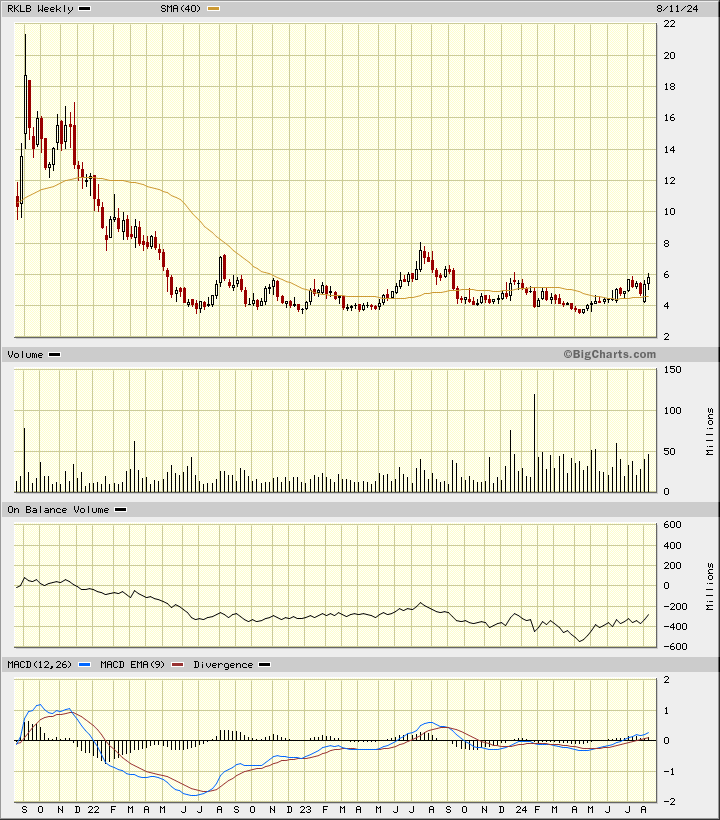
In the weekly Japanese candlestick chart of RKLB, below, I can see a developing base formation. Prices have found buying interest around $4 and selling resistance around $8. A weekly close above $8 will be an upside breakout.
Prices are now above the slowly rising 40-week moving average line. The weekly OBV line declined into a low in April and then began a positive trend. The MACD oscillator is now above the zero line -- a positive.
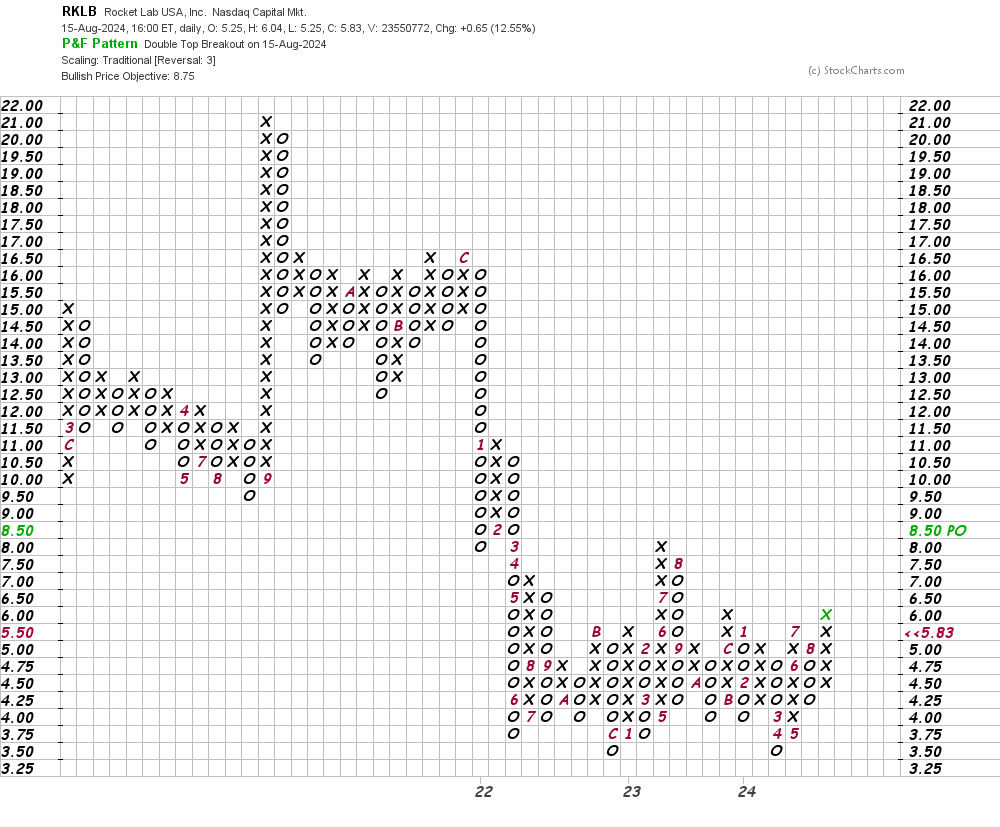
In this daily Point and Figure chart of RKLB, below, I can see a potential upside price target in the $9 area.
In this weekly Point and Figure chart of RKLB, below, I used a five box reversal filter. Here the software is projecting a price target in the $12 area.
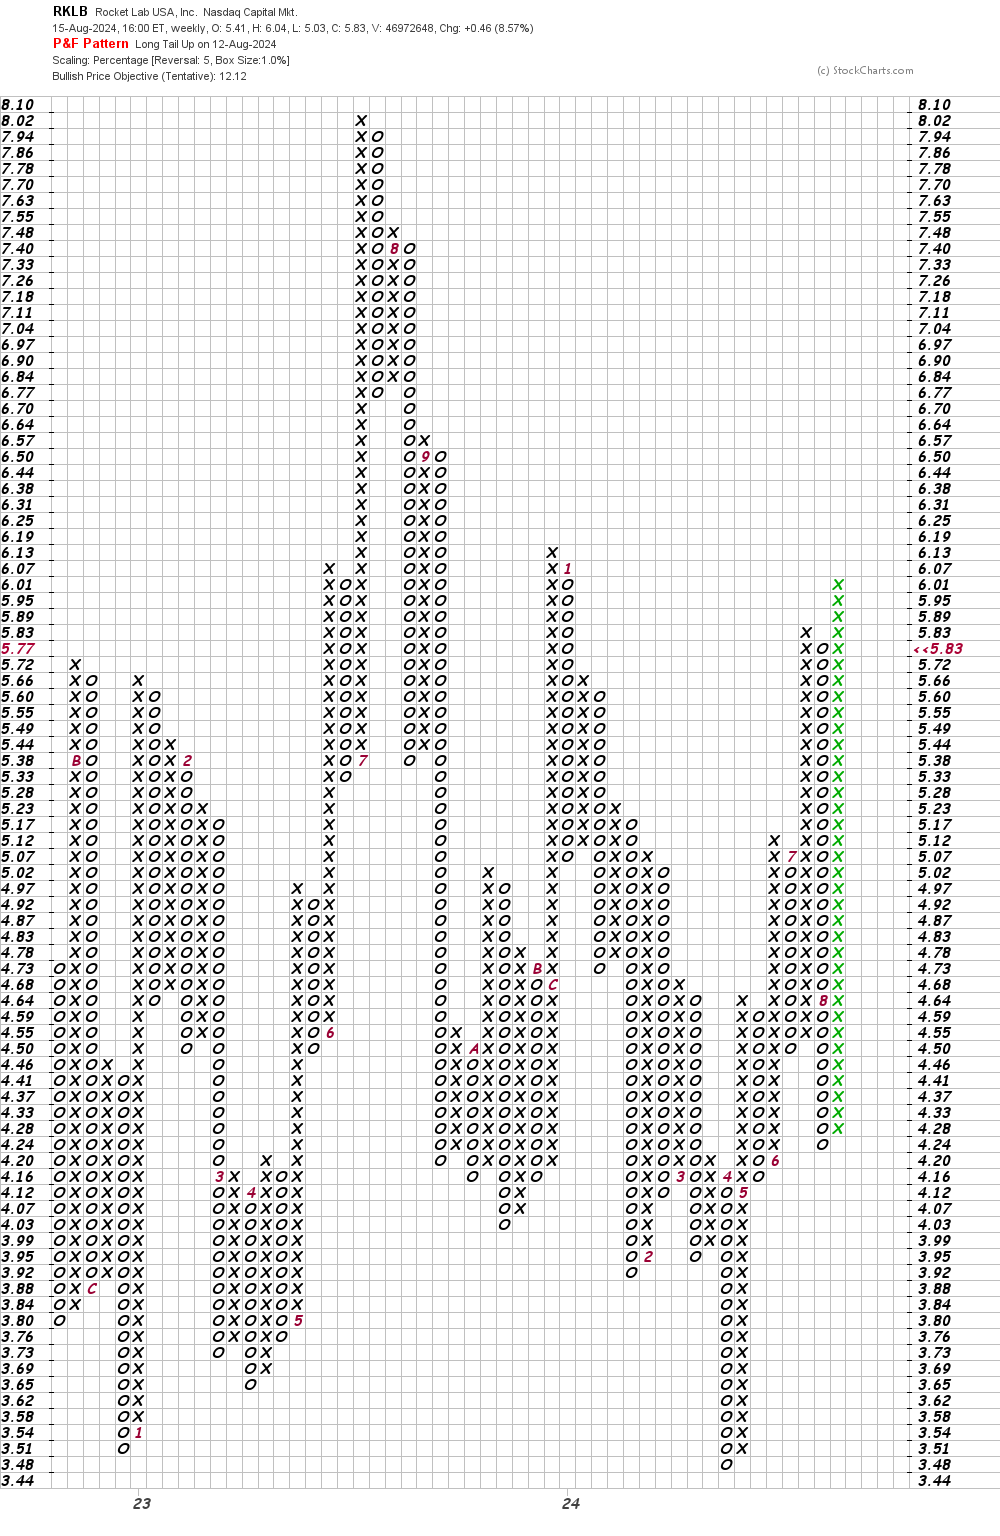
Bottom line strategy: I like the base pattern I see on RKLB. Traders could use available weakness toward $5.75 to build a long position. Risk to $4.75. Add to longs on strength above $8. The $12 area is my longer-term price objective.
Employees of TheStreet are prohibited from trading individual securities.