A Rising Wedge Pattern Signals Trouble for Alphabet Stock
Here's why traders who are long Google need to pay attention.
You've reached your free article limit
You've read 0 of 1 free Pro articles.
What is a rising wedge pattern and what does it mean for the direction of Alphabet GOOGL stock?
Chart patterns (often called voodoo by analysts and others who do not believe in technical analysis) have been around since the 1910s and predate fundamental analysis by a couple decades.
Let's examine the charts of GOOGL, as the Department of Justice begins its antitrust trial against Google, and parent company Alphabet.
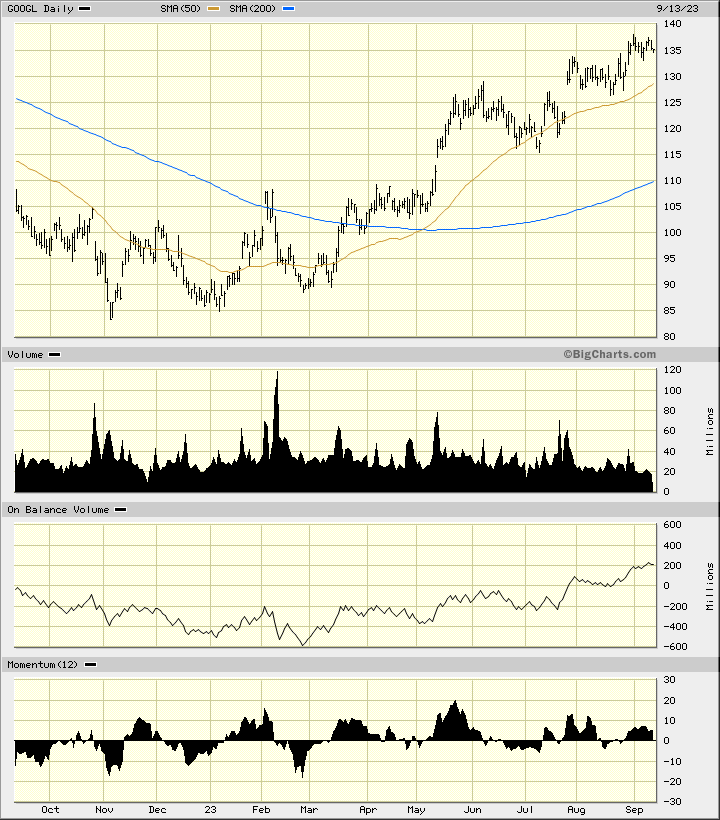
In the daily bar chart of GOOGL, below, I see a weakening picture. Then shares have rallied from a low in early November. Prices have risen while trading volume has been declining.
Old-time chart readers (who can recognize chart patterns) would be uncomfortable with a stock rise that was not accompanied by increasing volume. The daily On-Balance-Volume (OBV) line shows us and back and forth rise from February.
The 12-day price momentum study shows us a pattern of lower highs from May, which tells me that the pace of the rise has been slowing for months and this is a bearish divergence when compared to the price action.
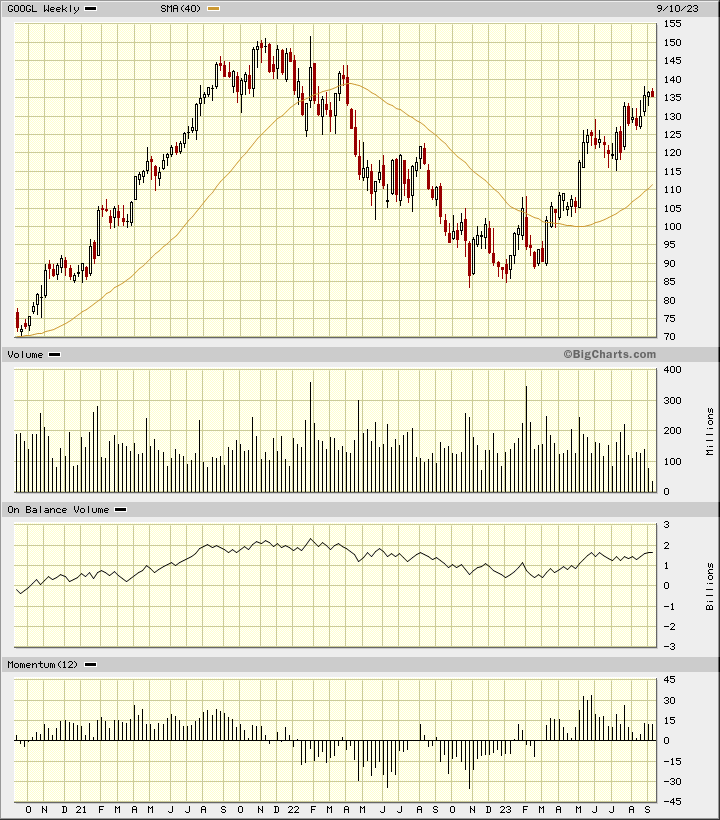
In the weekly Japanese candlestick chart of GOOGL, below, I see a weakening setup. The three most recent candles could be a top reversal pattern. The shares have rallied this year and trade above the rising 40-week moving average line.
The weekly volume histogram shows that trading volume has diminished on this rally. The OBV line has been stalled the past three months.
The 12-week price momentum study shows a weakening pattern from May.
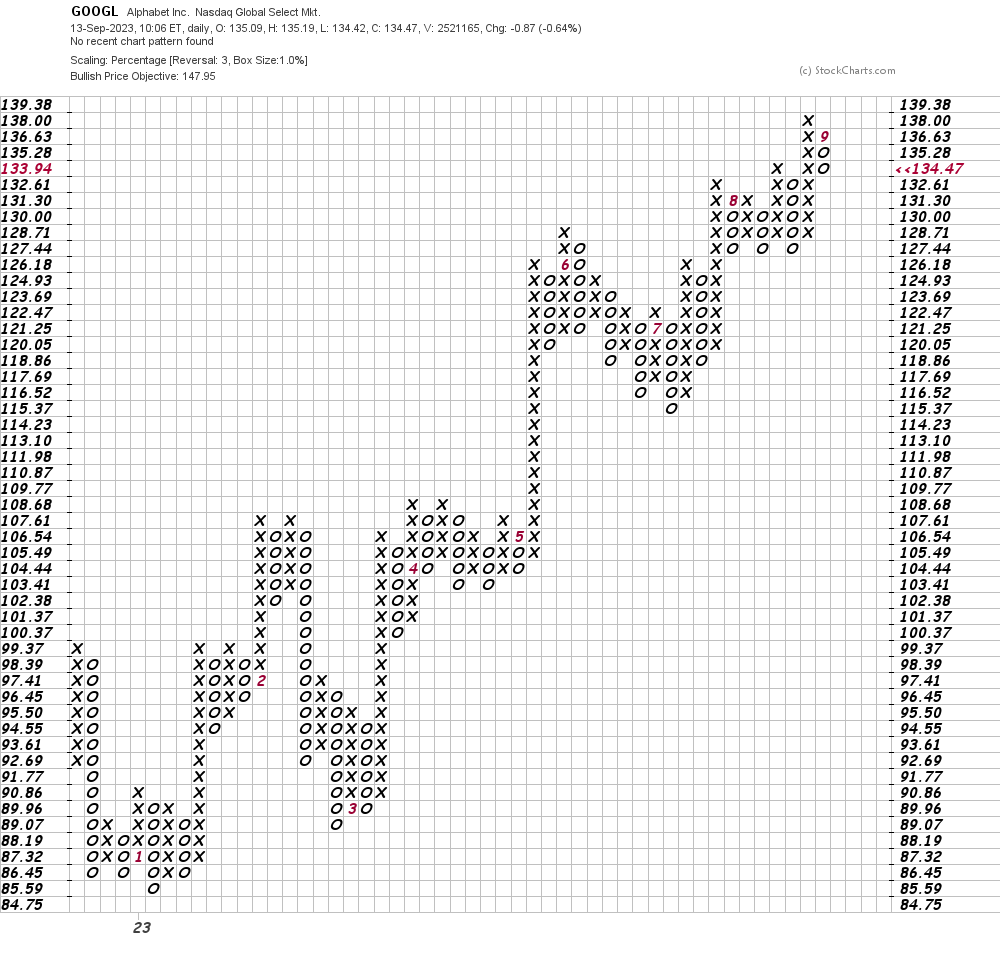
In this daily Point and Figure chart of GOOGL, below, I can see a potential upside price target in the $148 area.
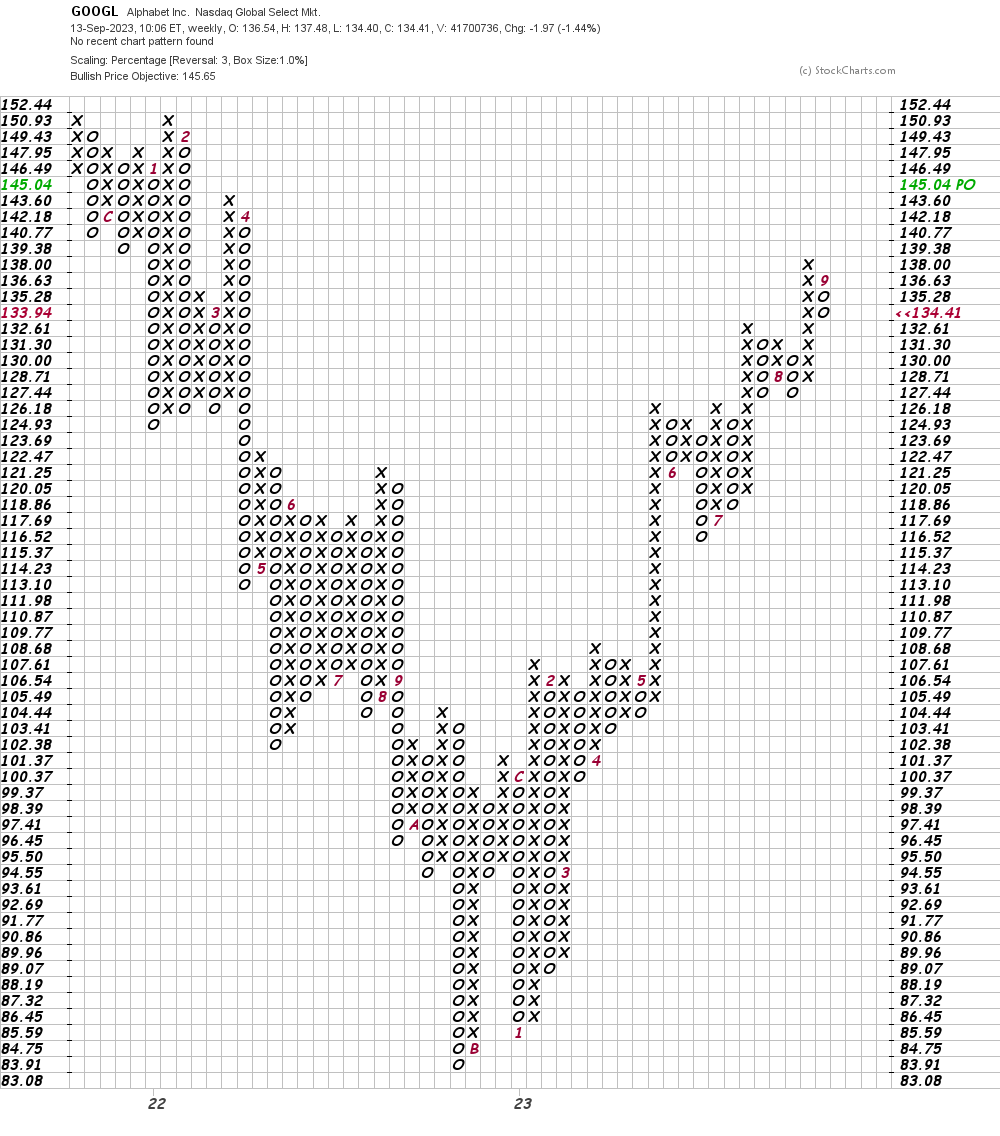
In this weekly Point and Figure chart of GOOGL, below, I can see an upside price target in the $146 area.
Bottom-line strategy: Rising wedges are bearish because trading volume has been shrinking and not expanding as prices rise. When a rising wedge starts to decline it is typically fast and it tends to retrace most if not all of its advance. Traders who are long GOOGL should consider selling those positions.
Want to learn more about chart patterns? Consider my book "Chart Patterns" from 2009 published by Bloomberg Press.
(GOOGL is a holding in TheStreet's Action Alerts PLUS portfolio. Want to be alerted before the portfolio buys or sells GOOGL and other stocks? Learn more now.)
Employees of TheStreet are prohibited from trading individual securities.