Perhaps We're Oversold Enough for Santa, but the Sentiment Isn't There
A look at market sentiment, as well as your questions.
You've reached your free article limit
You've read 0 of 1 free Pro articles.
The Market
As we go through some of the intermediate-term indicators that are pushing toward oversold readings, I want to make one thing clear: at this point in time, I have seen very little change in sentiment.
Anecdotally, I think last Wednesday’s whoosh and the give-up on Thursday contributed to some minor shifting about as some are now calling for a more choppy market going forward, but I do not see the type of sentiment that typically arrives with the amount of damage that has been done in the vast majority of stocks/groups.
Just consider for a minute how during that April decline we saw the Investors Intelligence bulls go from 62 to 46%. In August we saw a move from 64% to 46% and in September we got to 43% bulls Two weeks ago this survey was at 63% bulls and last week we were at 59%. It’s possible we’ll get that sort of move this coming week but that remains to be seen.
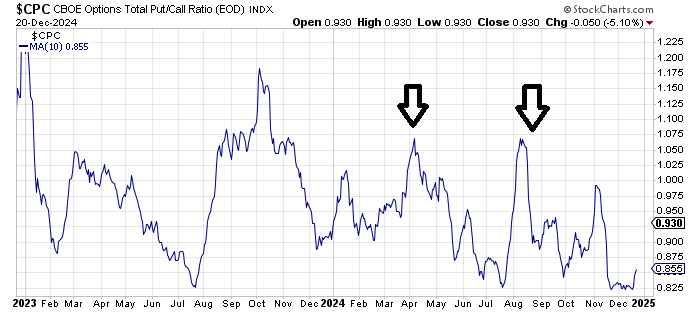
The put/call ratios have not gotten severe yet either. Thus far the highest reading we have seen is .98 on Thursday. That means the ten-day moving average is only now lifting off the lows. You can see April and August on the chart (arrows). We seem to have had more bearishness, or at least puts being bought, prior to the election than we saw last week.
It’s possible now that we bounced on Friday folks have quickly moved back to the Santa Rally camp (where I have been). And maybe I will be taken to the woodshed for thinking rally this coming week but I think due to the sentiment situation, even if intermediate-term indicators are –or are heading toward—an oversold condition, unless/until sentiment changes rallies should be viewed as short-term in nature.
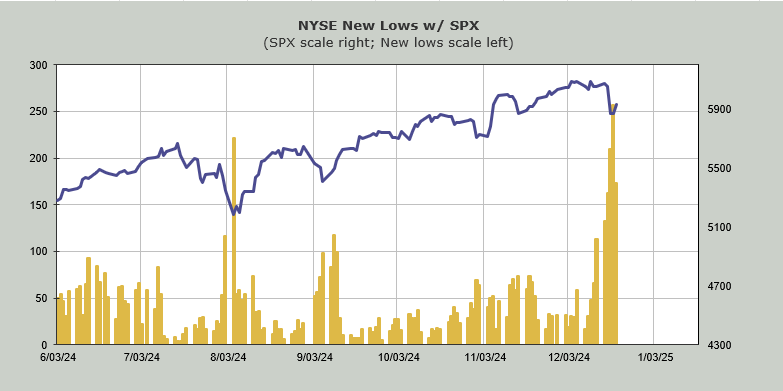
One thing that changed on Friday is that the indexes made lower lows and there were fewer stocks making new lows. To me that is a sign that we got oversold and the selling just stopped in what had been going down.
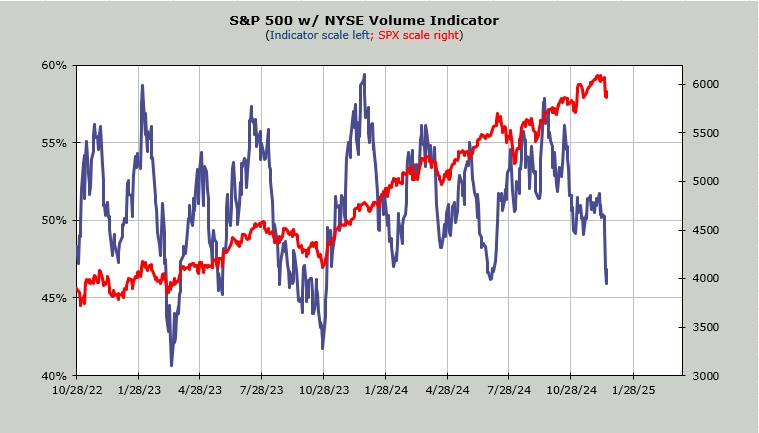
You already know about the Volume Indicator having reached 46% which is oversold territory. It can obviously go lower but at least it is now the most oversold since June, just before the 493 got their day in the sun.
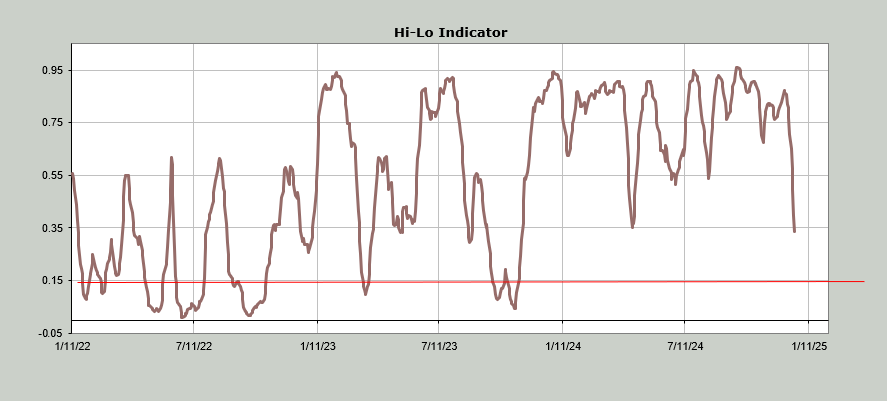
The Hi-Lo Indicator is something to behold. We typically look at the Nasdaq because it tends to swing more but here’s the NYSE where we can see it is now at .34, it is fractionally lower than it was in April. The math says it probably ticks down more even from here. It gets oversold under .15 (Nasdaq gets oversold under .20). Consider for a minute that the S&P is mere points off its high and this indicator is where it was in April when the S&P was 1000 points lower. So much for all that broadening out.
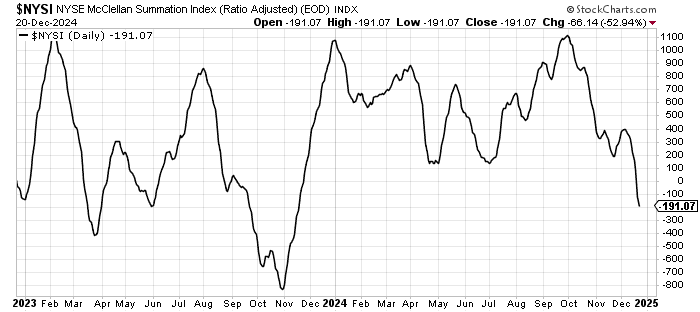
The McClellan Summation Index is still heading down, but as we discussed last week it needed +5200 advancers minus decliners to halt the decline which made it extreme (oversold). It currently needs +3200 so it is still several days away from halting the slide.
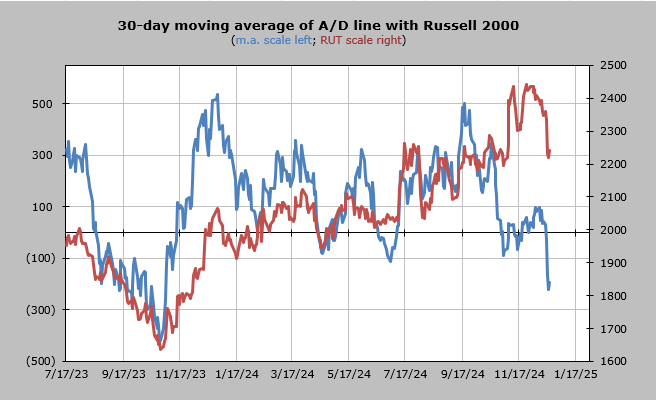
Then there is the more intermediate term Overbought/Oversold Oscillator, the 30-day ma of the advance/decline line. Look how far this has fallen, now at the lowest level since the fall of 2023. That again shows how much weakness there is under the surface. This is now moderately oversold.
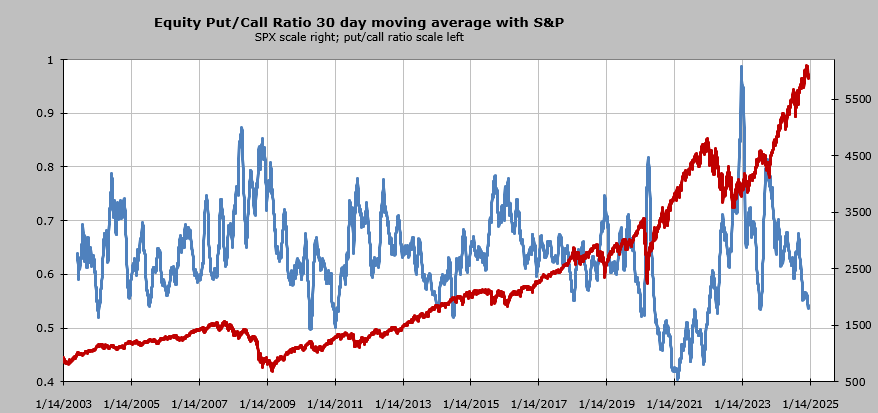
I’m going to leave you with a final intermediate-term chart, this one of sentiment. The 30-day moving average of the equity put/call ratio has mostly stayed in the range between .50 and .80 for the last two decades. It is now where it was in July 2023, just prior to the ten percent pullback over the ensuing three months. While some of the momentum indicators are coming up on oversold readings not seen since the fall of 2023, note that in the fall of 2023 this was over .80, not at .54 where it currently is.
I’m still looking for a rally this coming week, even if we’re down on Monday but I would treat it as a trade because these sentiment indicators –at least right now—say there is more bullishness to wring out.
New Ideas
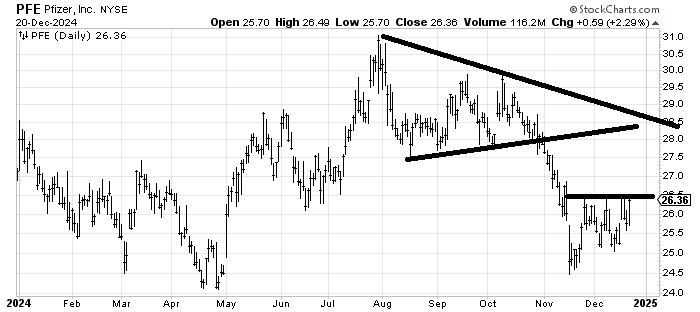
I was asked to follow up on Pfizer PFE which has been trying to bottom for a month now and each time it gets here it goes right back down. I am starting to wonder if like Boeing which was so hated (but has done so nicely lately) PFE is also too hated.
If it can get through this 26.50 area it still runs into trouble 27.50-28 but think how much that would change the look of the chart.
Today’s Indicator
The Hi-Lo Indicator is discussed above along with the chart.
Q&A/Reader’s Feedback
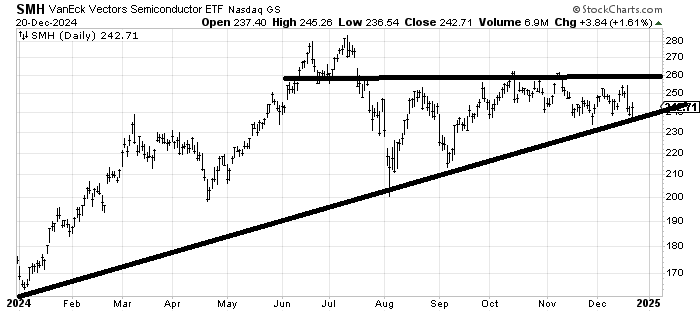
I tend to look at the SOX index and not SMH the etf folks use to trade the semis. You may recall I had been looking for a pop in the SOX to 5200 a couple of weeks ago and we got it before it headed right back down. The SOX has a clearer picture than the SMH. Mostly I think the moves have gotten so small that if we got a breakout in either direction it would be meaningful.
Let me note that if we use the SOX, the 50 and 200 dma’s are both heading down (slightly) and are only about 20 points apart. That would mean it is likely if the lower line is breached the 50 day would slip under the 200 day. That would be intermediate term bearish.
For now I would play the range but be very cognizant of a break in either direction. So a stop under that 235-ish area is warranted.
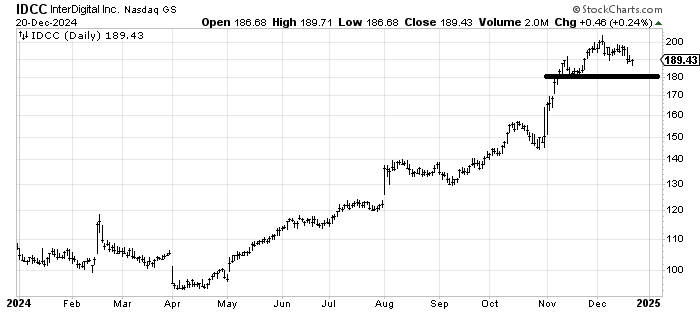
I have a lot of charts that look like InterDigital IDCC such as the banks or software stocks. They haven’t done anything wrong yet but they are not my style to buy. IDCC has support in the 180 area and so if it breaks under there you should be concerned.
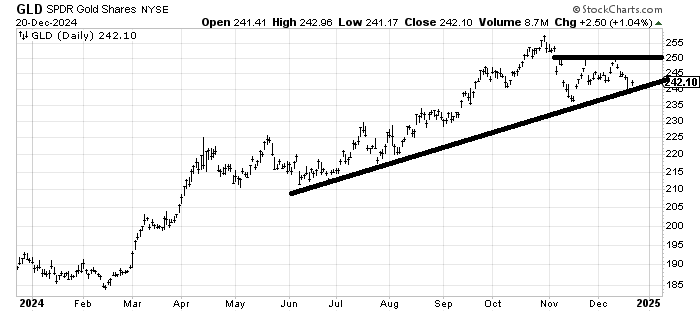
GLD, an etf to be long gold, is a chart I have been neutral on for months and I remain there. Like the SMH the range is getting very small so I would respect a breakout but until we get a breakout we can play the range between240 and 250. The DSI for gold got to 36 last week so even that tells us how lackluster this precious metal has been.