Oracle Rally Likely to Keep Fading
The software giant has seen an uptrend since the end of last year, but a close look at the stock charts suggests that will soon change.
You've reached your free article limit
You've read 0 of 1 free Pro articles.
Software giant Oracle ORCL has been in an uptrend since December, but the advance may be coming to an end.
Let's check out the trends and indicators for an update.
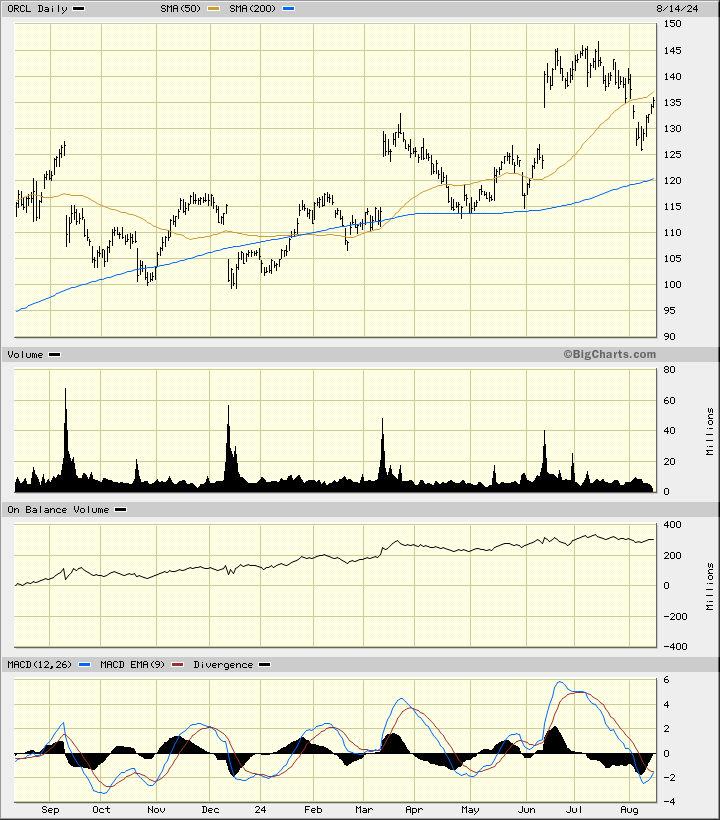
In this daily bar chart of ORCL below, I see that prices broke below the 50-day moving average line and are now rallying back to the underside of that average line. The slower-to-react 200-day moving average line is still bullish. The On-Balance-Volume (OBV) line has made little upside progress in the past five months. The Moving Average Convergence Divergence (MACD) oscillator is below the zero line.
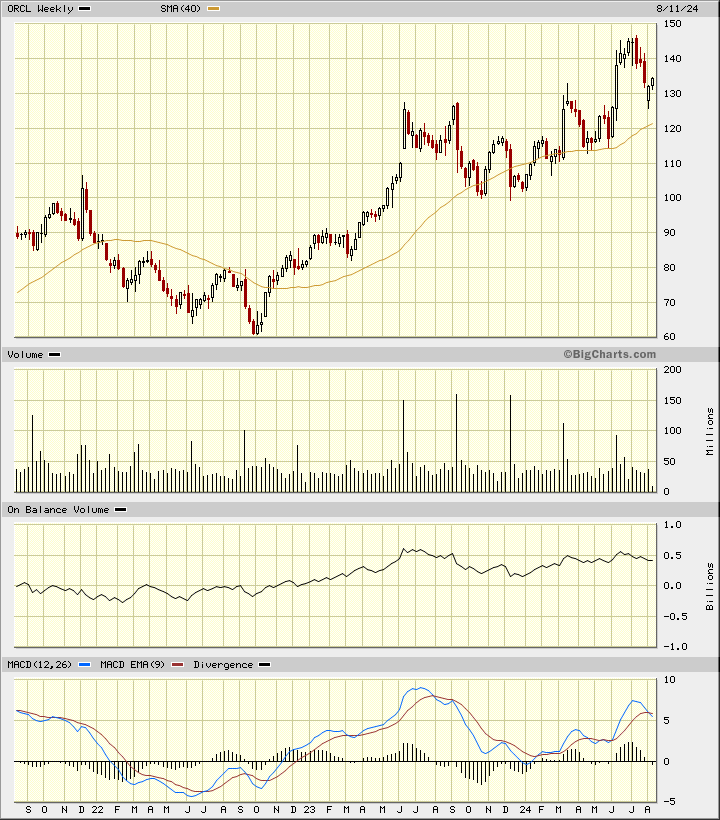
In this weekly Japanese candlestick chart of ORCL below, I can see a weakening picture. Prices are trading above the 40-week moving average line but the slope of the line is beginning to crest. The OBV line shows weakness since early July and tells me that sellers of ORCL have been more aggressive than buyers. The MACD oscillator has crossed to the downside for a take profits sell signal.
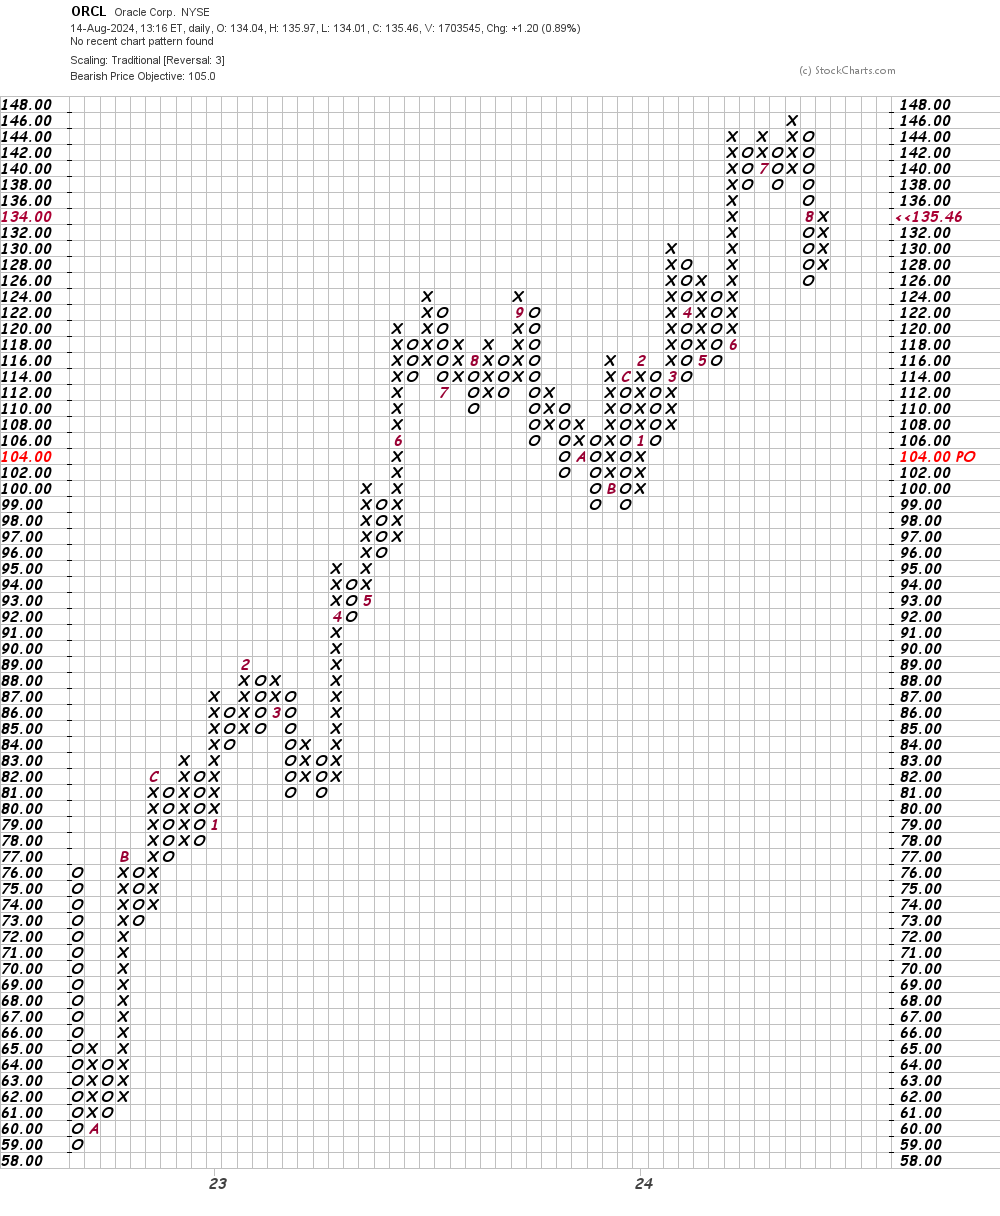
In this daily Point and Figure chart of ORCL below, I can see that the software is projecting a downside price target in the $105 area.
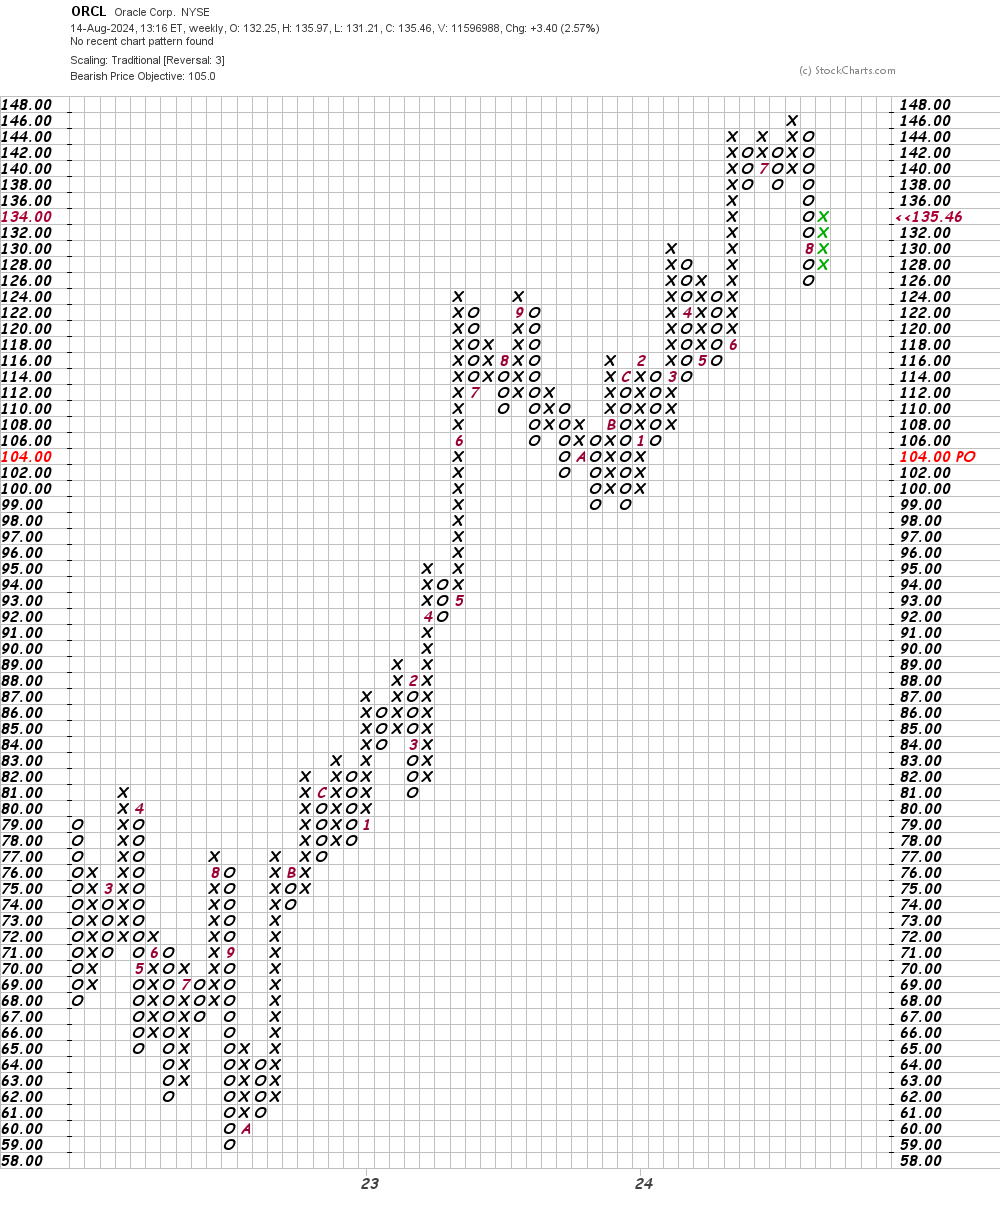
In this weekly Point and Figure chart of ORCL below, I can see the same downside price target of $105 — the same as the daily chart above.
Bottom line strategy: The rally in ORCL has been fading the past six weeks and that trend may well continue.
Employees of TheStreet are prohibited from trading individual securities.