Nvidia Weakness Turns Sharp as Investors Seek Support
A lot of people have piled into Nvidia. Some will be heading for the door.
You've reached your free article limit
You've read 0 of 1 free Pro articles.
Flash back to your childhood. The "Chicken Little" fairy tale. It was a story by Joseph Jacobs and a softer version of the tale about a chicken that wanted to warn a king that the sky is falling.
The fable came to mind as stock prices fell sharply on Thursday and have been hitting the skids again on Friday.
I get a fair amount of emails from subscribers and today the emails have been focused on Nvidia NVDA. "Where is support?" is the question of the day and the question implies that some traders have not sold their positions. Go back and reread my comments from June 5, 2024 for some reference.
Let's jump ahead to the charts.
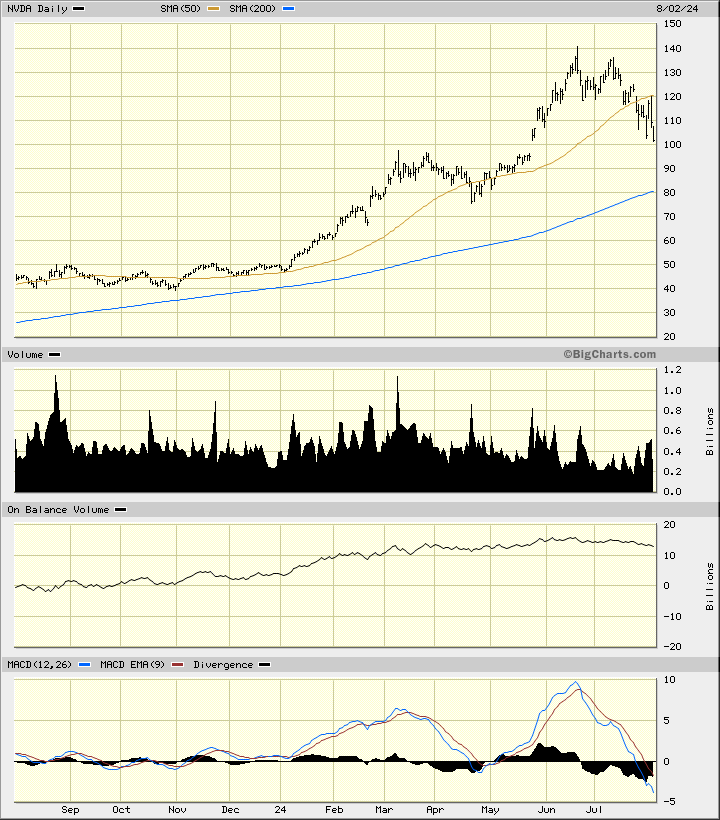
In this daily bar chart of NVDA below, I can see that prices made a small top in the $130 to $140 area in June and July. Prices turned lower and have spent the last week or so below the cresting 50-day moving average line. The trading volume has increased since the middle of July and suggests that investors are voting with their feet and selling.
The On-Balance-Volume (OBV) has been weakening since the middle of June and tells me that sellers of NVDA have been more aggressive than buyers. The Moving Average Convergence Divergence (MACD) oscillator is now below the zero line in sell territory. The rising 200-day moving average line intersects down around $80. Reading the chart from right to left (that is the way to do it) there may be a band of support in the $105 to $97 area, give or take.
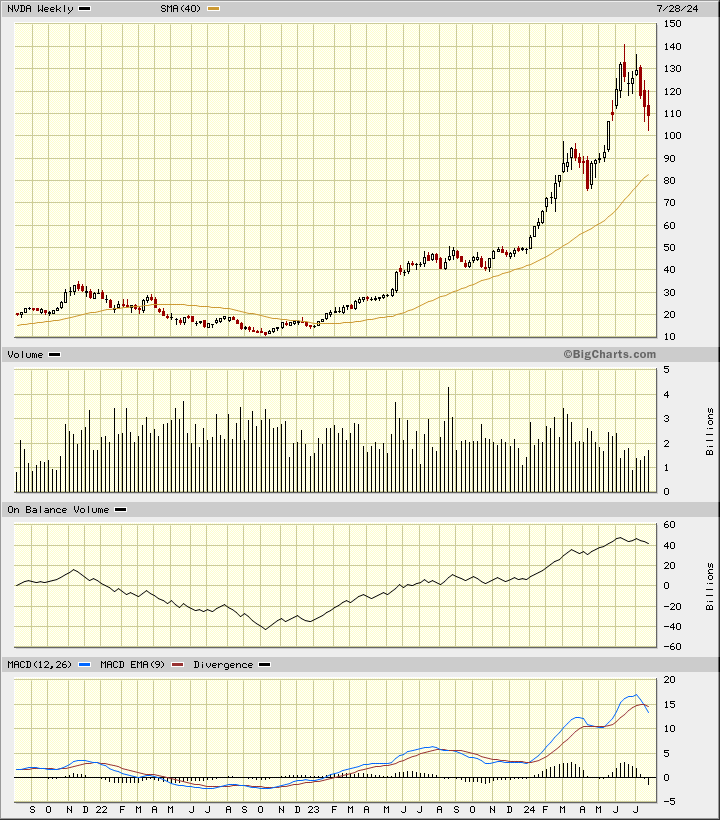
In this weekly Japanese candlestick chart of NVDA below, I can see that upper shadows in June and July told us that traders rejected the highs despite all the bullish fundamental reports from the sell side during that time.
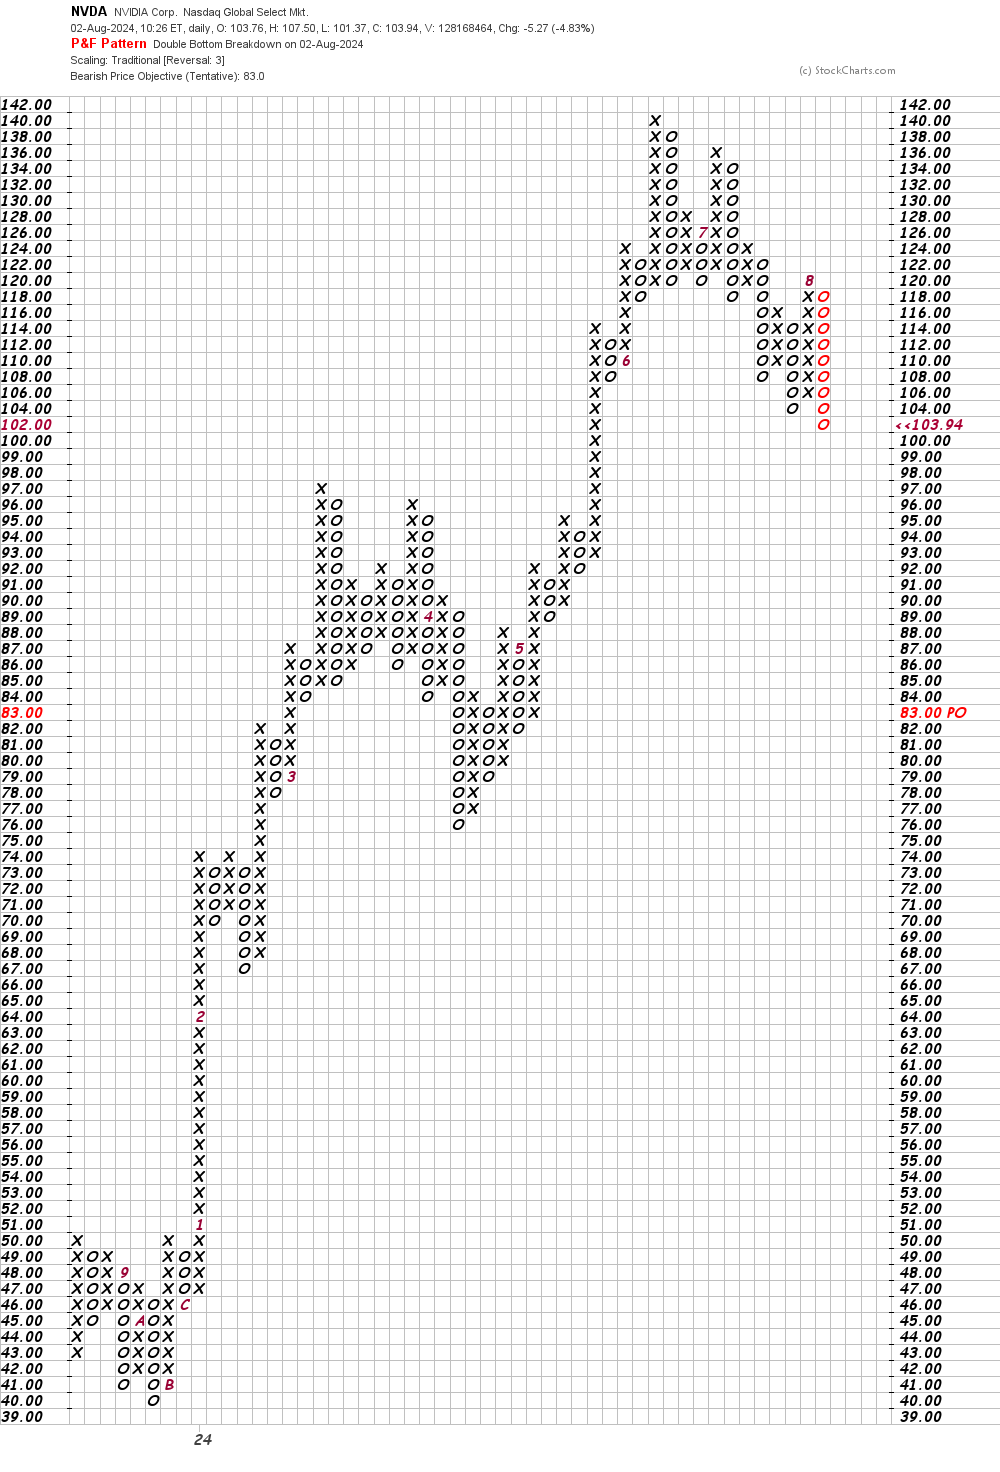
In this daily Point and Figure chart of NVDA below, I can see a potential downside price target in the $83 area. A move like this, should it happen, will scare even so-called long-term investors.
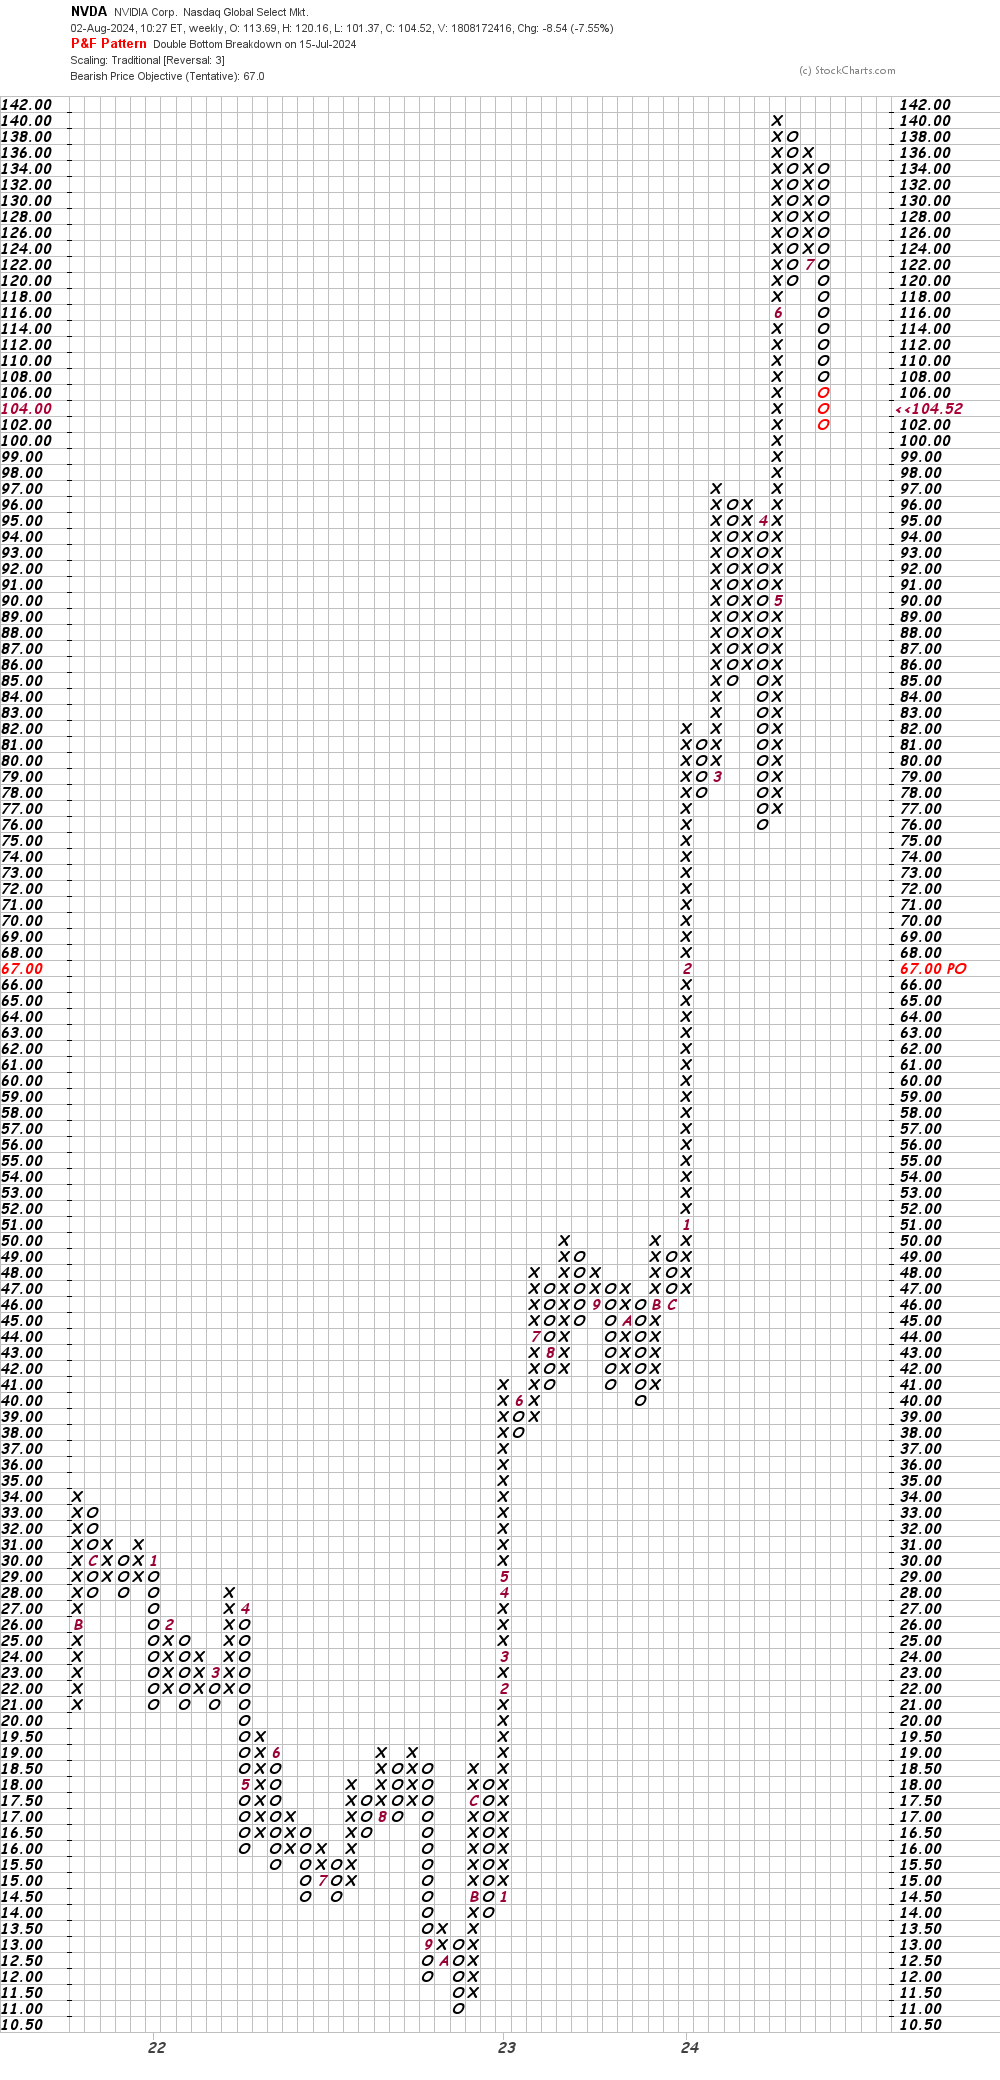
In this weekly Point and Figure chart of NVDA below, the software is suggesting a price target in the $67 area.
Bottom line strategy: Shallow weakness is OK, but sharp weakness is not OK, even in a bull market. Why? Buying sharp weakness is like trying to catch a falling knife. You really can't know for sure where it will stop.
A lot of people, both individual investors and highly-paid money managers, have piled into NVDA. Some will be heading for the door. "Don't fight the tape" is an old saying that has new meaning today.
Employees of TheStreet are prohibited from trading individual securities.