Niccol for My Thoughts: Is Chipotle's Great Ride Over?
Is the guacamole fresh or not after the CEO's departure for Starbucks? Let's check the charts and indicators.
You've reached your free article limit
You've read 0 of 1 free Pro articles.
It has been a busy few weeks at Chipotle Mexican Grill CMG. The fast casual restaurant chain reported their latest quarterly numbers in late July but the bigger news was that CEO Brian Niccol jumped ship to try his magic at Starbucks SBUX.
Out of the grill and into the percolator so to speak.
CMG has some 2322 institutional owners and shareholders and I wonder if some of them have decided the great ride is over? It has been reported that Bill Ackman owns almost 825,000 shares of CMG stock but he sold off about 130,000 shares in the 2024 fourth quarter. Is someone else about to hit the sell button?
Let's check out the charts and indicators.
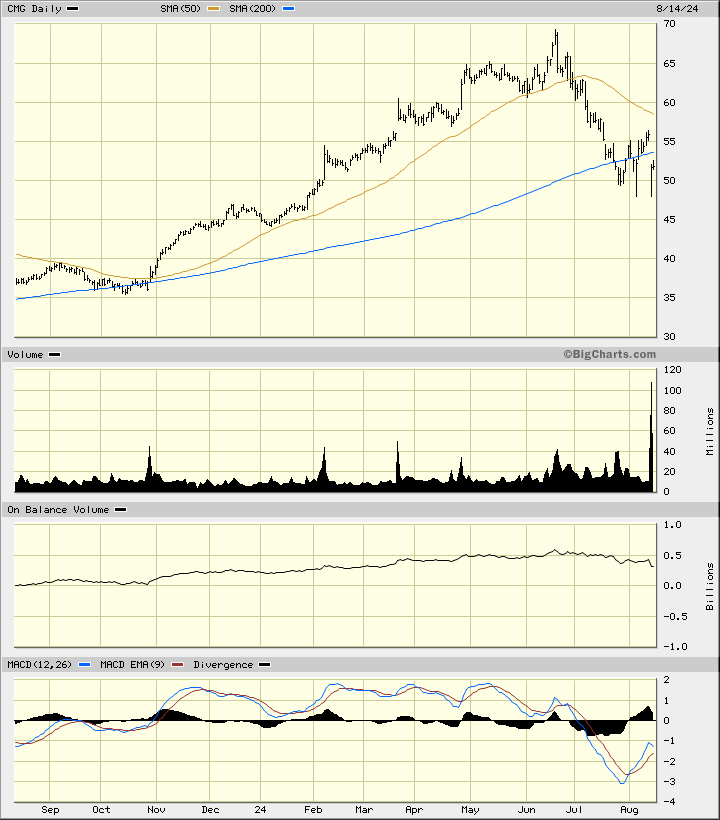
In the daily bar chart of CMG, below, I can see that the shares made a high and turned lower in late June ahead of earnings and the c-suite change. Trading volume has been more active since the middle of June and tells me that some investors and traders have been selling shares.
The On-Balance-Volume (OBV) line shows weakness since the middle of June and it means that traders have shifted from being aggressive buyers to aggressive sellers. The trend-following Moving Average Convergence Divergence (MACD) oscillator is below the zero line but off its weakest level.
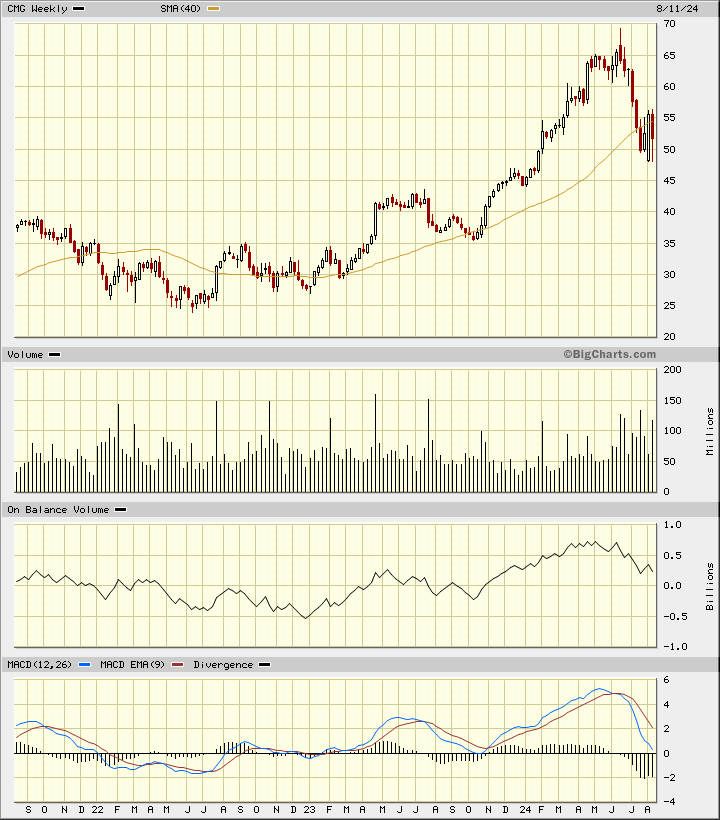
In this weekly Japanese candlestick chart of CMG, below, I can see an impressive rise the past two years plus (These are split adjusted prices). CMG got extended (overbought) above the rising 40-week moving average line in June (notice the upper shadow right at the peak?). CMG has pulled back to the 40-week moving average line and has traded around it.
The OBV line shows weakness since May and foreshadowed the peak in prices. The MACD oscillator has crossed to the downside and is headed down to the zero line.
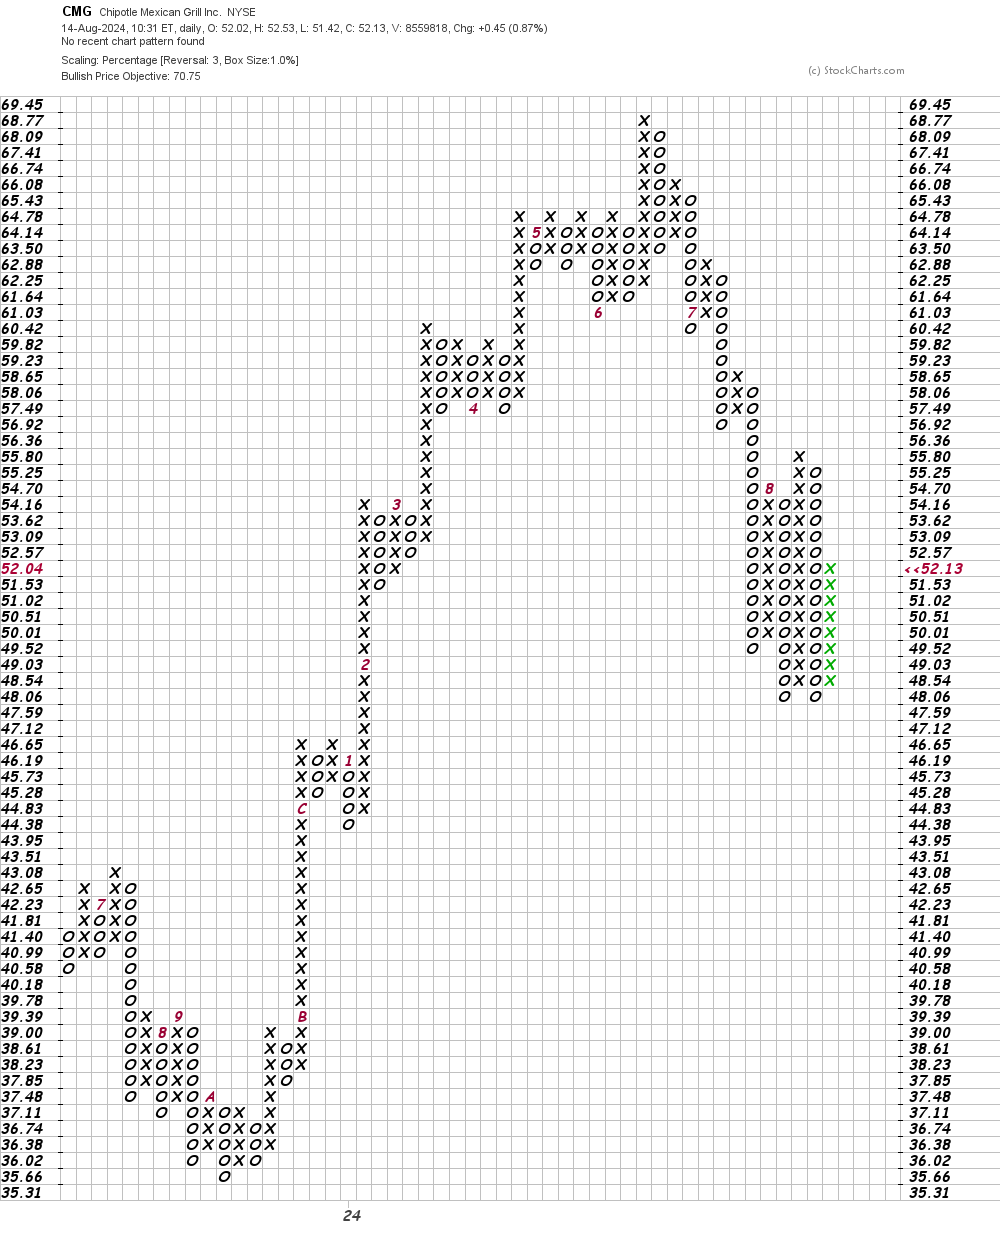
In this daily Point and Figure chart of CMG, below, I can see a potential upside price target in the $71 area. A trade at $74.59 will refresh the downtrend.
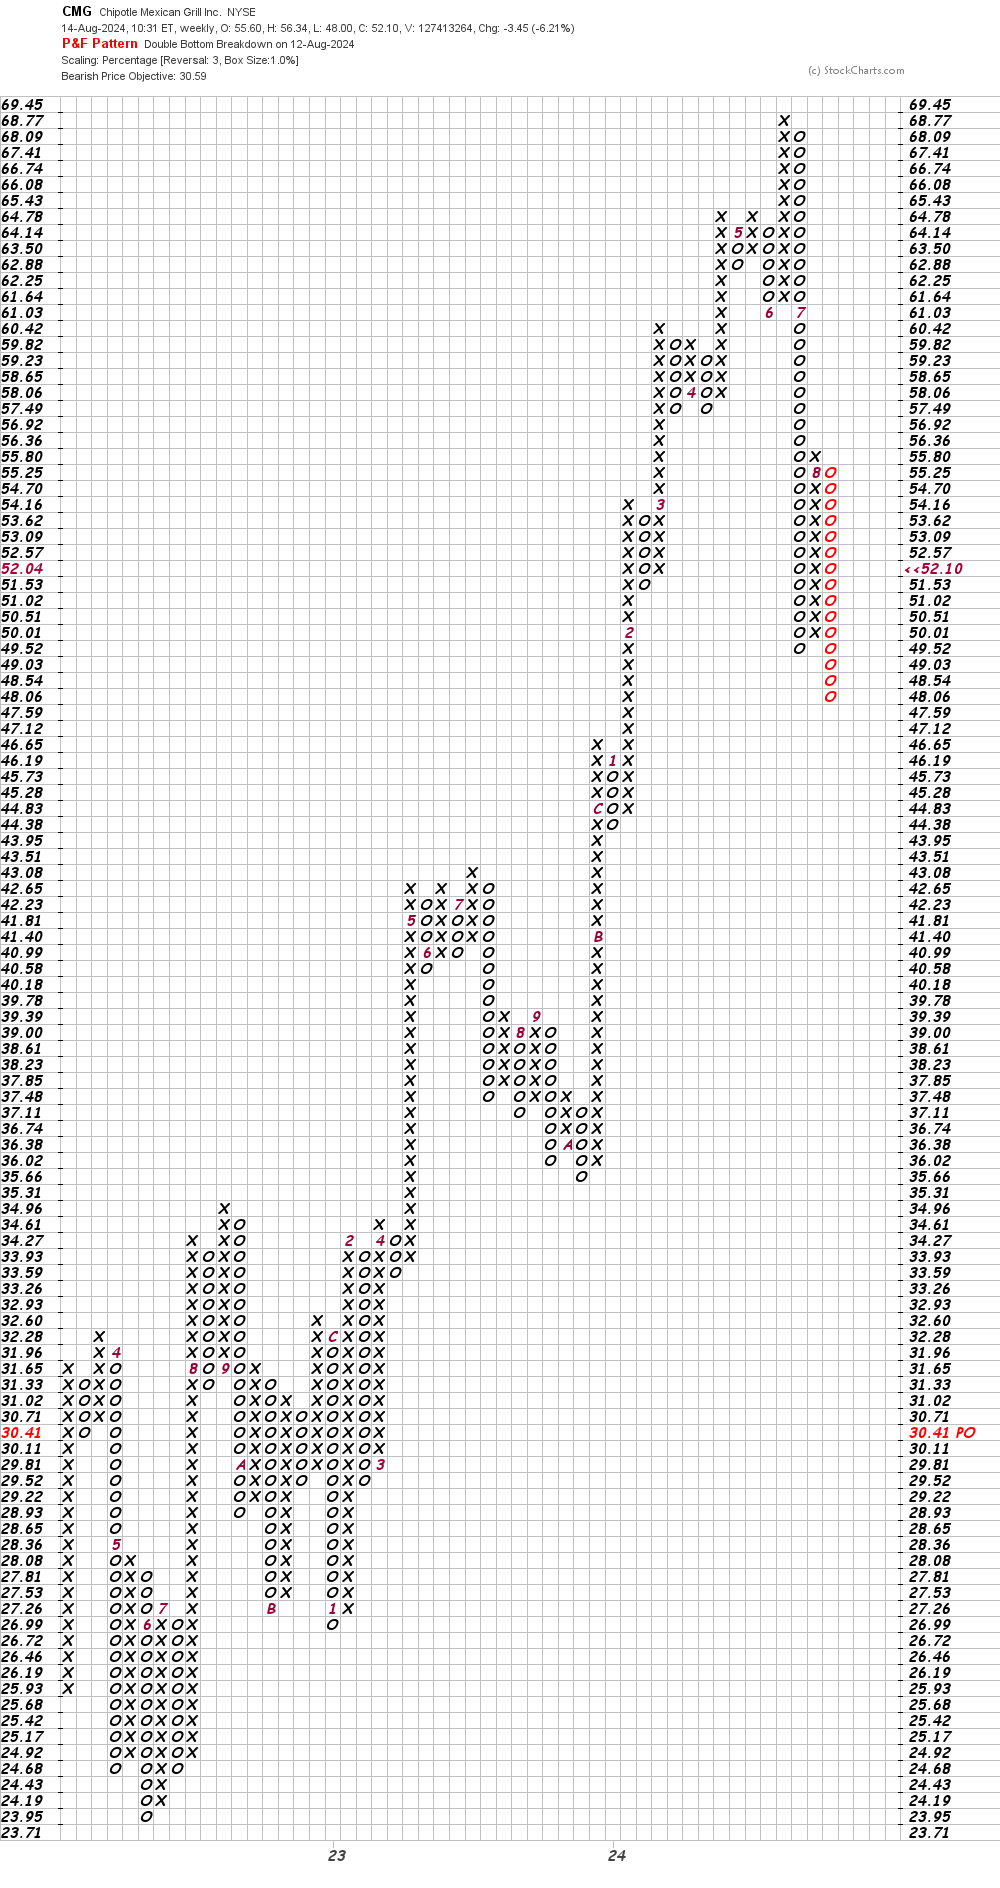
In this weekly Point and Figure chart of CMG, below, I can see a potential downside price target in the $31 area.
Bottom-line strategy: The second you open that avocado, it's a race against the clock before it goes brown. Is CMG in a race before it turns lower? Tuesday's price action on CMG was encouraging but one day typically does not make a durable low or a bottom.
There are lots of stocks on the menu and it may pay to check them out before going long CMG.
Employees of TheStreet are prohibited from trading individual securities.