Newmont Now Has a Golden Opportunity
Let's check out the charts and indicators of this gold miner.
You've reached your free article limit
You've read 0 of 1 free Pro articles.
Newmont Corp NEM has not participated in the resurgence of precious metals until Thursday when they reported that gold sales and production rose more than 30% Y/Y in Q1 and the stock rallied,
Let's check out the charts and indicators of this gold miner.
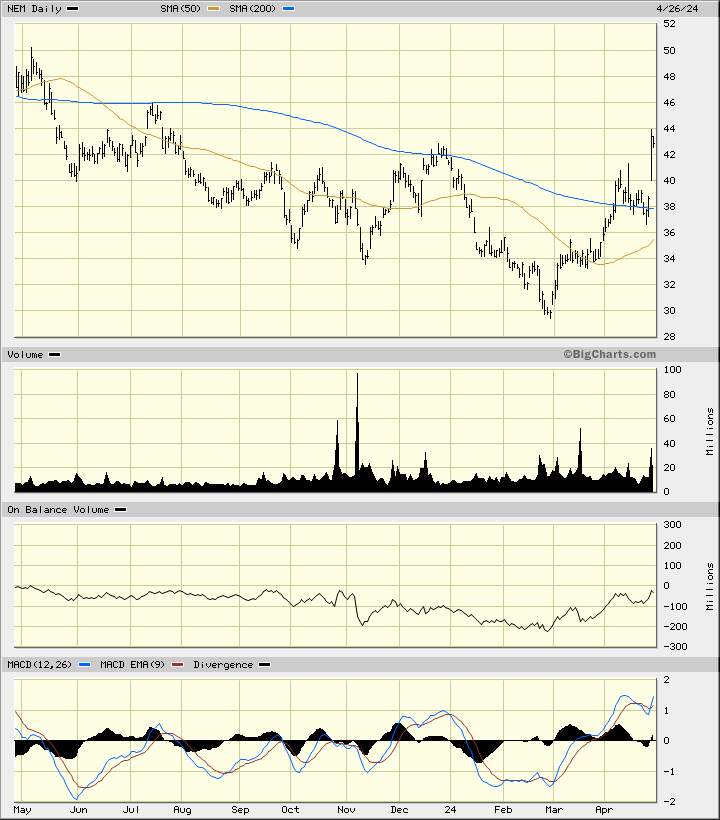
In this daily bar chart of NEM, below, I can see that prices have surged higher the past two months. Prices have been trading above the rising 50-day moving average line and now are firmly above the bottoming 200-day moving average line.
The On-Balance-Volume (OBV) line has turned to the upside since February and tells us that traders have become aggressive buyers of the stock The Moving Average Convergence Divergence (MACD) is in a bullish alignment above the zero line.
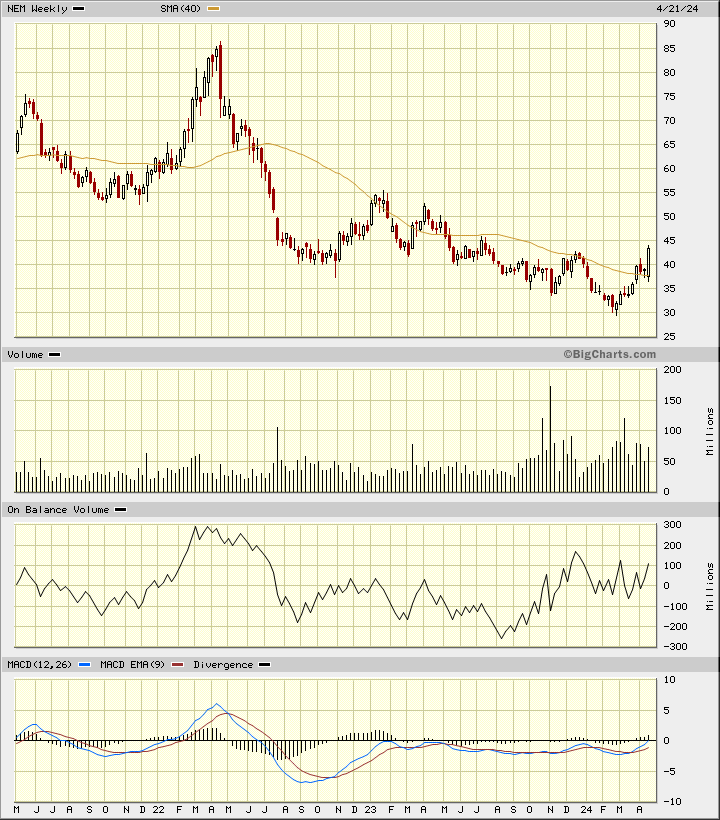
In this weekly Japanese candlestick chart of NEM, below, I can see that prices have broken above the declining 40-week moving average line and above a downtrend line (not drawn). The weekly trading volume has been more active since October and that tells me that investor interest has picked up significantly.
The weekly OBV line is moving higher and the MACD oscillator is about to cross above the zero line for an outright buy signal.
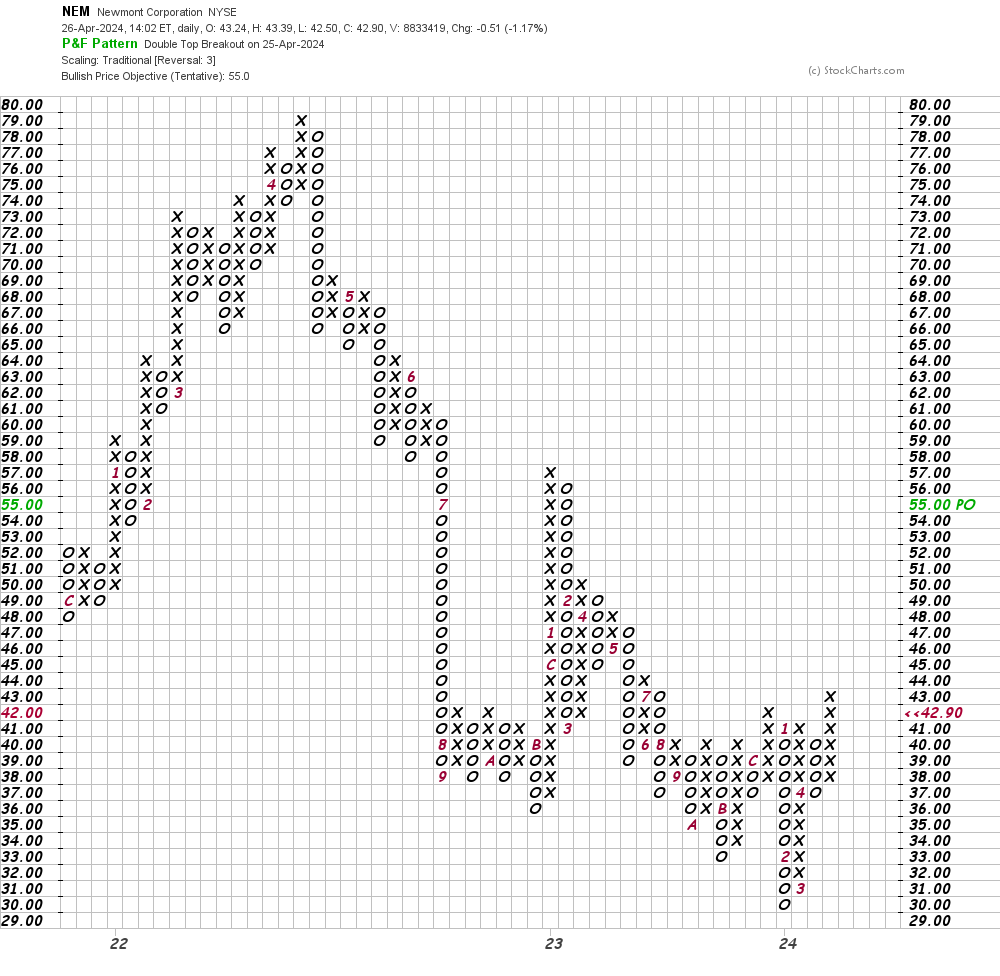
In this daily Point and Figure chart of NEM, below, I can see an upside price target in the $55 area.
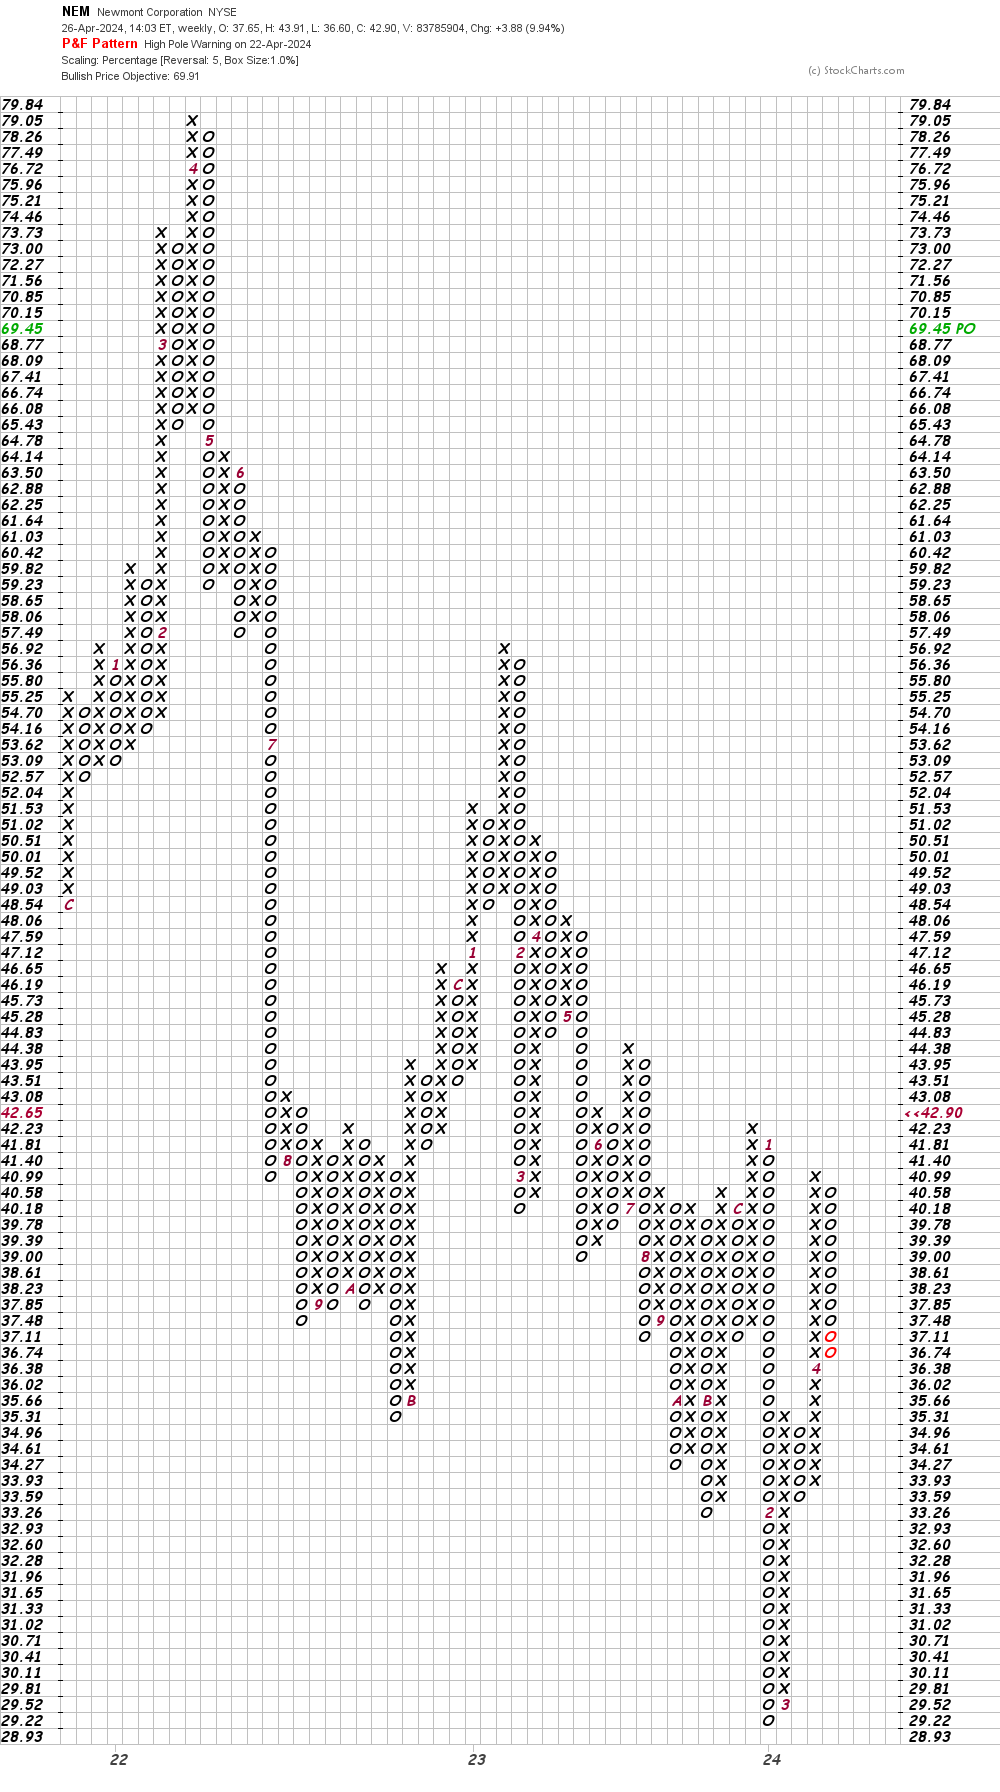
In this weekly Point and Figure chart of NEM, below, I used a five box reversal filter. Here the software projects a price target in the $70 area.
Bottom line strategy: Gold prices and NEM may or may not pullback much so traders should use available weakness to go long NEM. Risk to $36. The $55 area is my first upside price target.
Employees of TheStreet are prohibited from trading individual securities.