A New Price Objective for PayPal
The online payment leader seems poised for an upside breakout and we've got a price target for traders.
You've reached your free article limit
You've read 0 of 1 free Pro articles.
The online payment system PayPal PYPL has made a new 52-week high on the charts for an upside breakout. Let's check the charts and indicators and present some upside price targets.
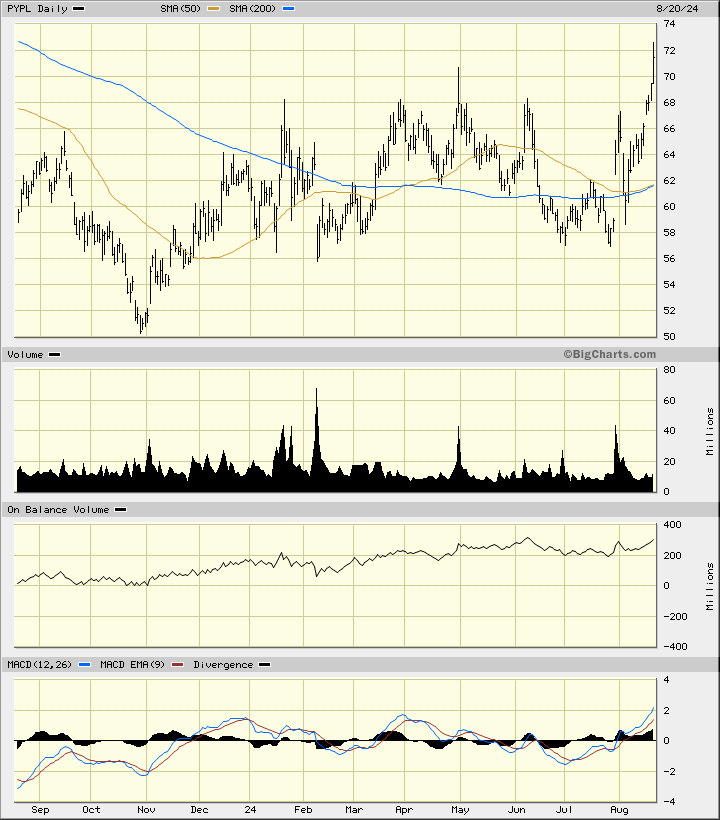
In this daily bar chart of PYPL below, I can see that prices have broken out over the highs of the first seven months of 2024. PYPL trades above the rising 50-day moving average line and the rising 200-day moving average line. The volume histogram does not show us a pattern of increasing volume and does not (yet) show us what I consider a level of "breakout volume."
The daily On-Balance-Volume (OBV) line has a positive trend and tells me that buyers of PYPL have been more aggressive than sellers. The trend-following Moving Average Convergence Divergence (MACD) oscillator has moved above the zero line for an outright buy signal.
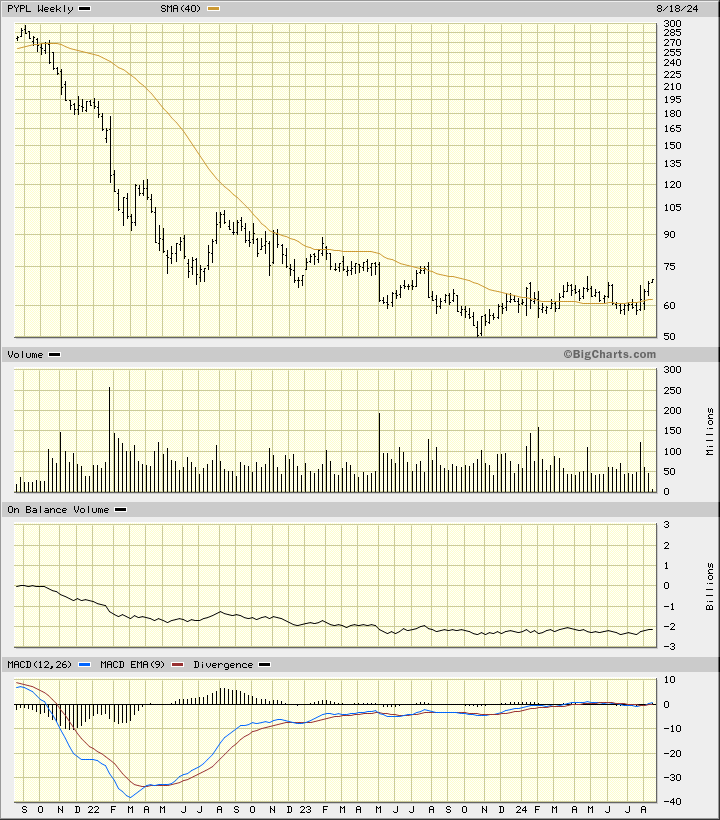
In this weekly bar chart of PYPL below, I used log scaling to show the price action, PYPL has been hammering out a base pattern. PYPL trades above the bottoming 40-week moving average line. The OBV line has been flat/dull for several months now but shows some recent improvement. The MACD oscillator is slightly above the zero line.
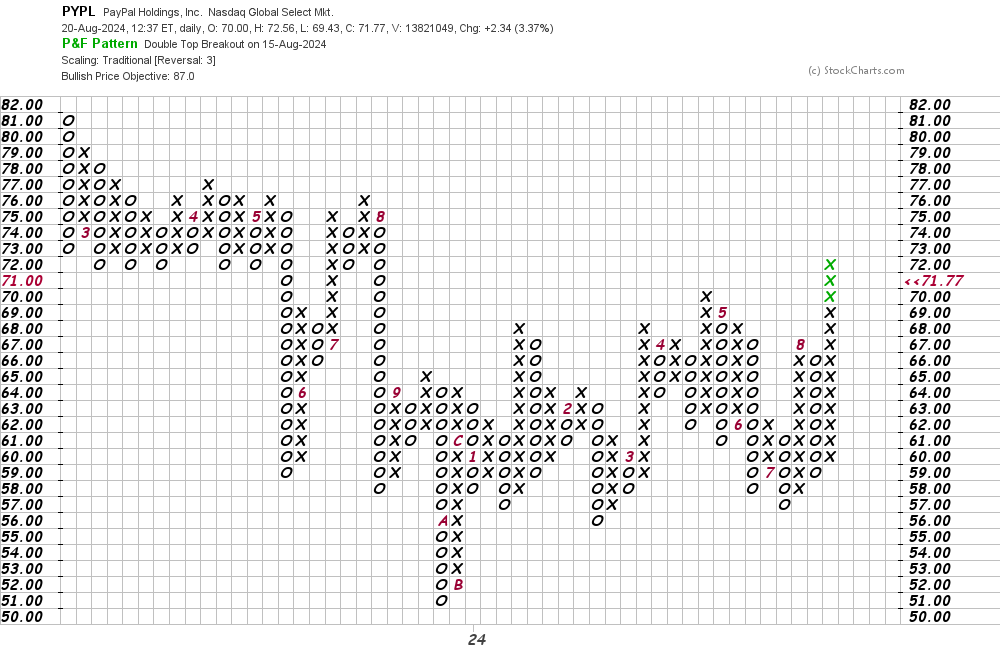
In this daily Point and Figure chart of PYPL below, I can see an upside breakout at $71 and a price target in the $87 area.
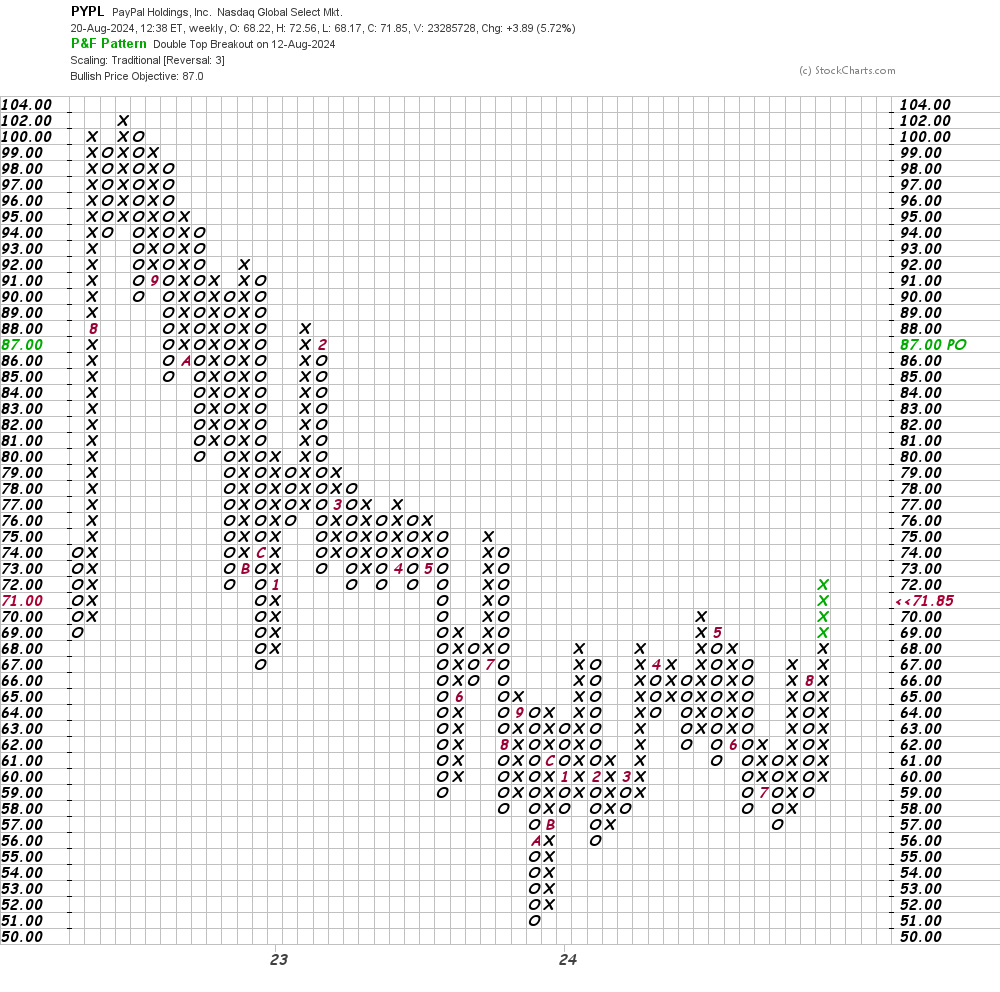
In this second Point and Figure chart of PYPL below, I used weekly price data. Here, the software shows us a bigger base but the same $87 price target.
Bottom line strategy: Traders could go long PYPL on a one or two-day shallow dip. Risk to $64 for now. The $87 area is my price objective.
Employees of TheStreet are prohibited from trading individual securities.