Neurocrine Biosciences Stock Charts Show Upside Breakout
I'm raising my price target for this biopharma holding as a close look at the charts shows bullish potential.
You've reached your free article limit
You've read 0 of 1 free Pro articles.
Neurocrine Biosciences NBIX is involved with "discovering and developing life-changing treatments for patients with debilitating neurological, neuroendocrine and neuropsychiatric disorders."
Let's check out the charts and indicators to see how that mission is translating into the stock price.
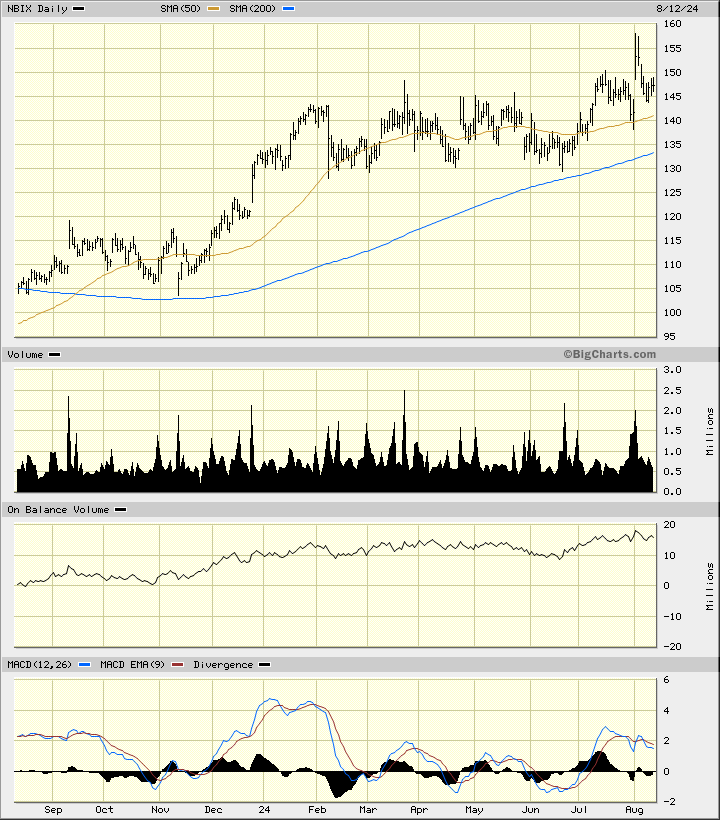
In this daily bar chart of NBIX below, I can see that prices have traded higher over the past 12 months. NBIX is trading above the rising 50-day moving average line and above the rising 200-day line. The On-Balance-Volume (OBV) has been generally moving higher the past year. The Moving Average Convergence Divergence (MACD) oscillator is above the zero line.
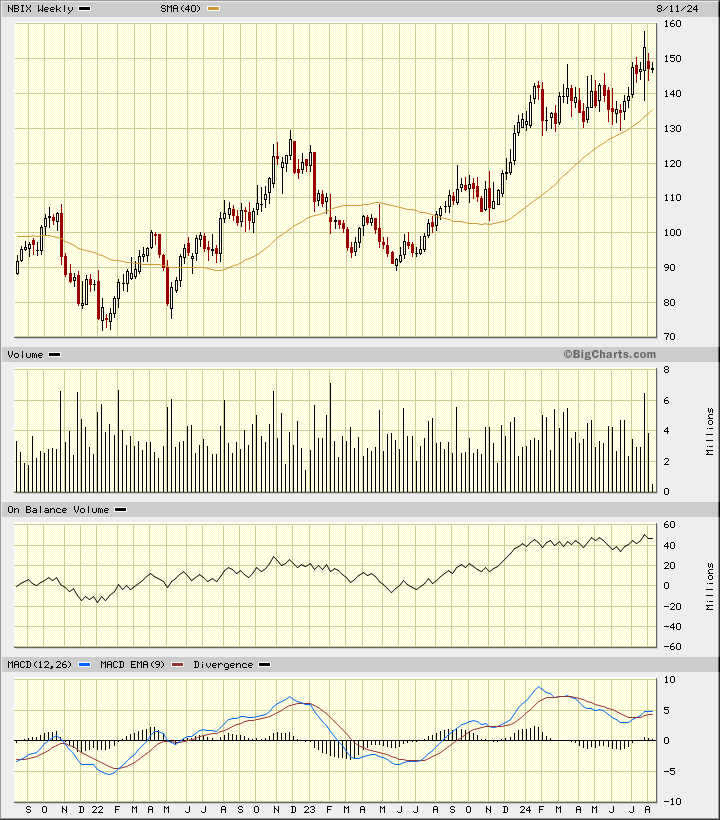
In this weekly Japanese candlestick chart of NBIX below, I can see that prices have doubled in the past three years. Prices trade above the rising 40-week moving average line. The positive trend of the OBV line supports and confirms the price gains we have seen. The MACD oscillator is in a positive alignment above the zero line.
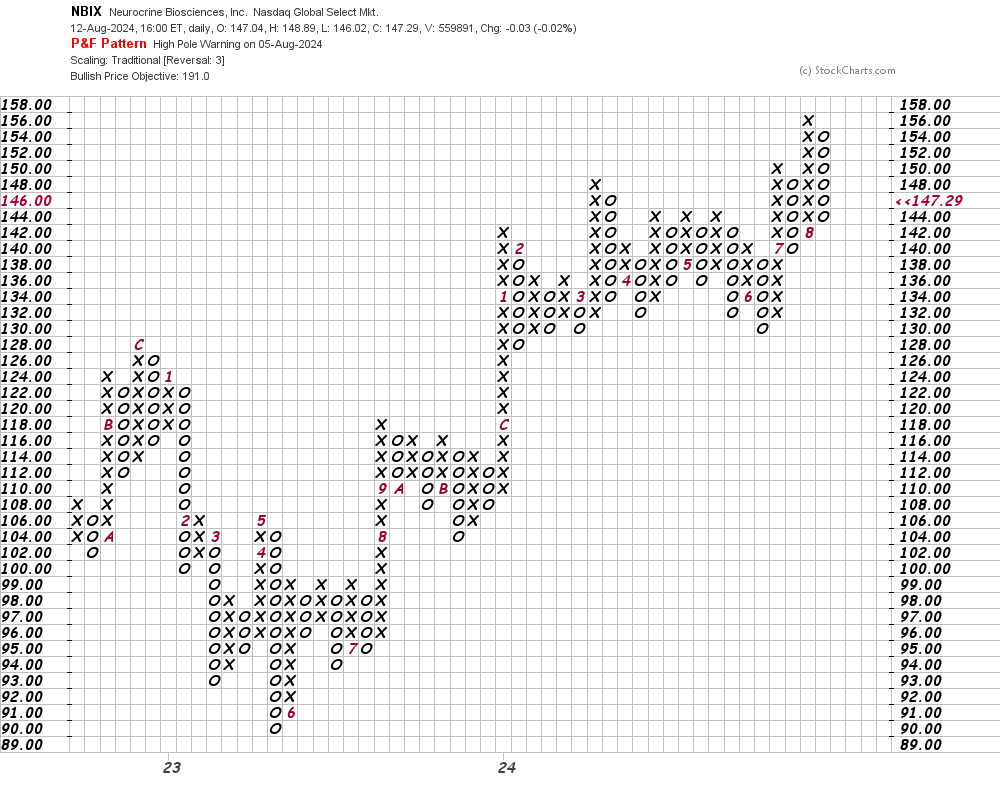
In this daily Point and Figure chart of NBIX below, I can see a potential upside price target in the $191 area. A trade at $158 should refresh the uptrend.
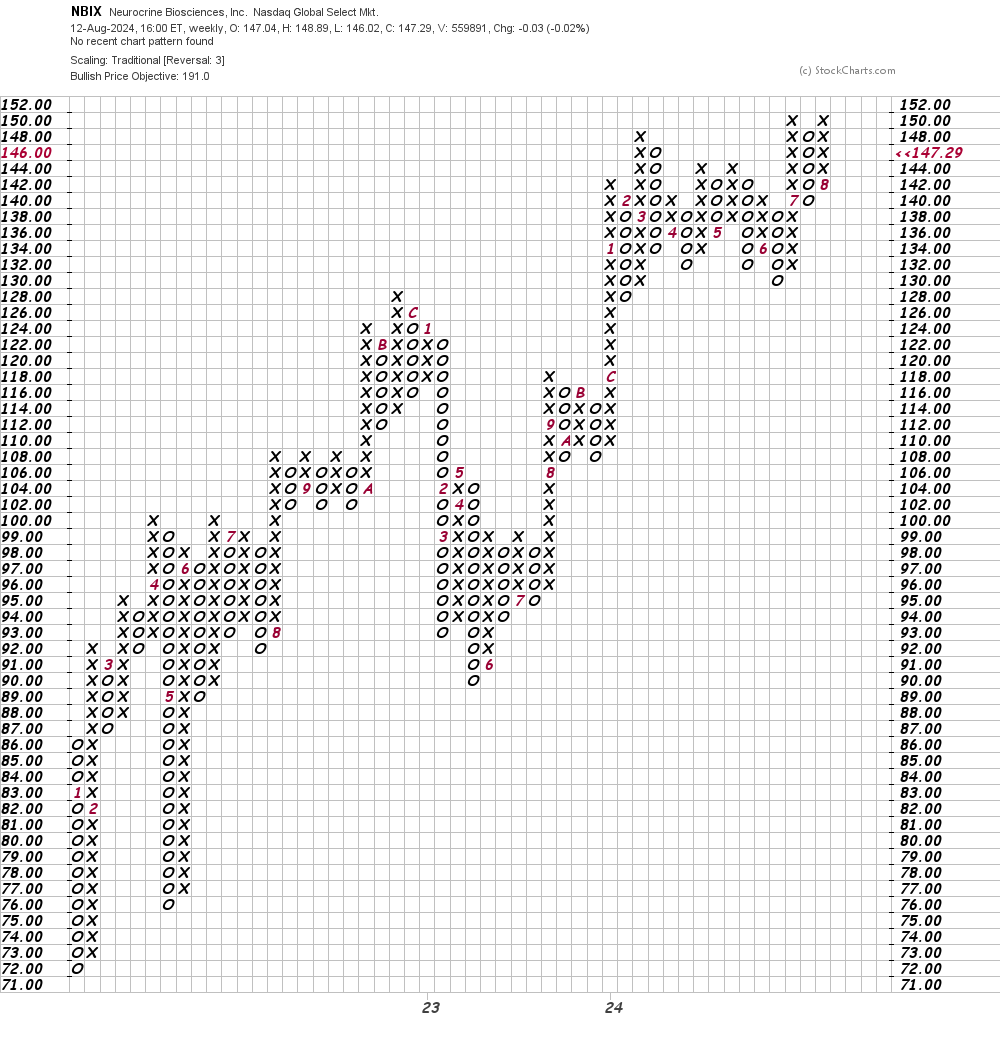
In this weekly Point and Figure chart of NBIX below, I can see that a weekly trade at $152 will refresh the uptrend and be an upside breakout for potential gains to the $191 area.
Bottom line strategy: I recommended purchase of NBIX back on April 24, 2024, writing that, "Traders could use available price weakness to add to longs. Risk a close below $128. The $170 area is the price target for now."
Traders could raise stops to a close below $135 as I raise my target price to the $191 area.
Employees of TheStreet are prohibited from trading individual securities.