Macy's Buyers Are Leaving With Empty Shopping Bags
After calling off ongoing negotiations to go private, the department store giant might see prices continue to weaken.
You've reached your free article limit
You've read 0 of 1 free Pro articles.
Macy's M called off negotiations with Arkhouse and Brigade Capital who were bidding on the retailer to take it private. Let's check out the charts and indicators for an update.
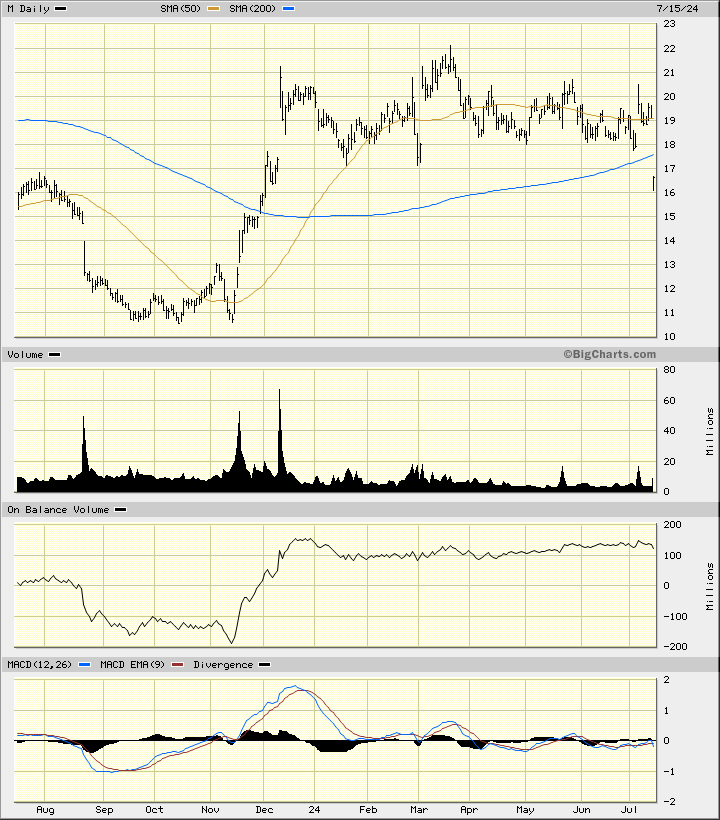
In this daily bar chart of M below, I can see that prices gapped lower Monday morning. Prices opened below the 200-day moving average line on heavy trading volume. The On-Balance-Volume (OBV) line has started to edge lower as traders have become more aggressive sellers. The Moving Average Convergence Divergence (MACD) oscillator has been below the zero line for much of the past three months.
In this weekly Japanese candlestick chart of M below, I have to imagine the price action for the week as this chart will not be updated until Friday's close. Prices are trading below the 40-week moving average line. The weekly OBV line shows weakness since March. The MACD oscillator has been correcting lower since March.
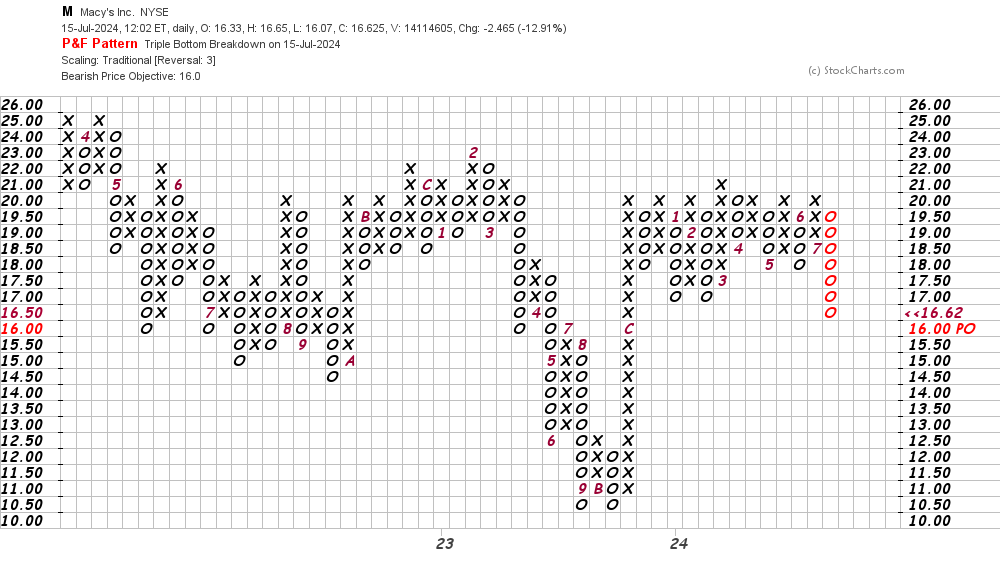
In this daily Point and Figure chart of M below, I can see a downside price target of $16.
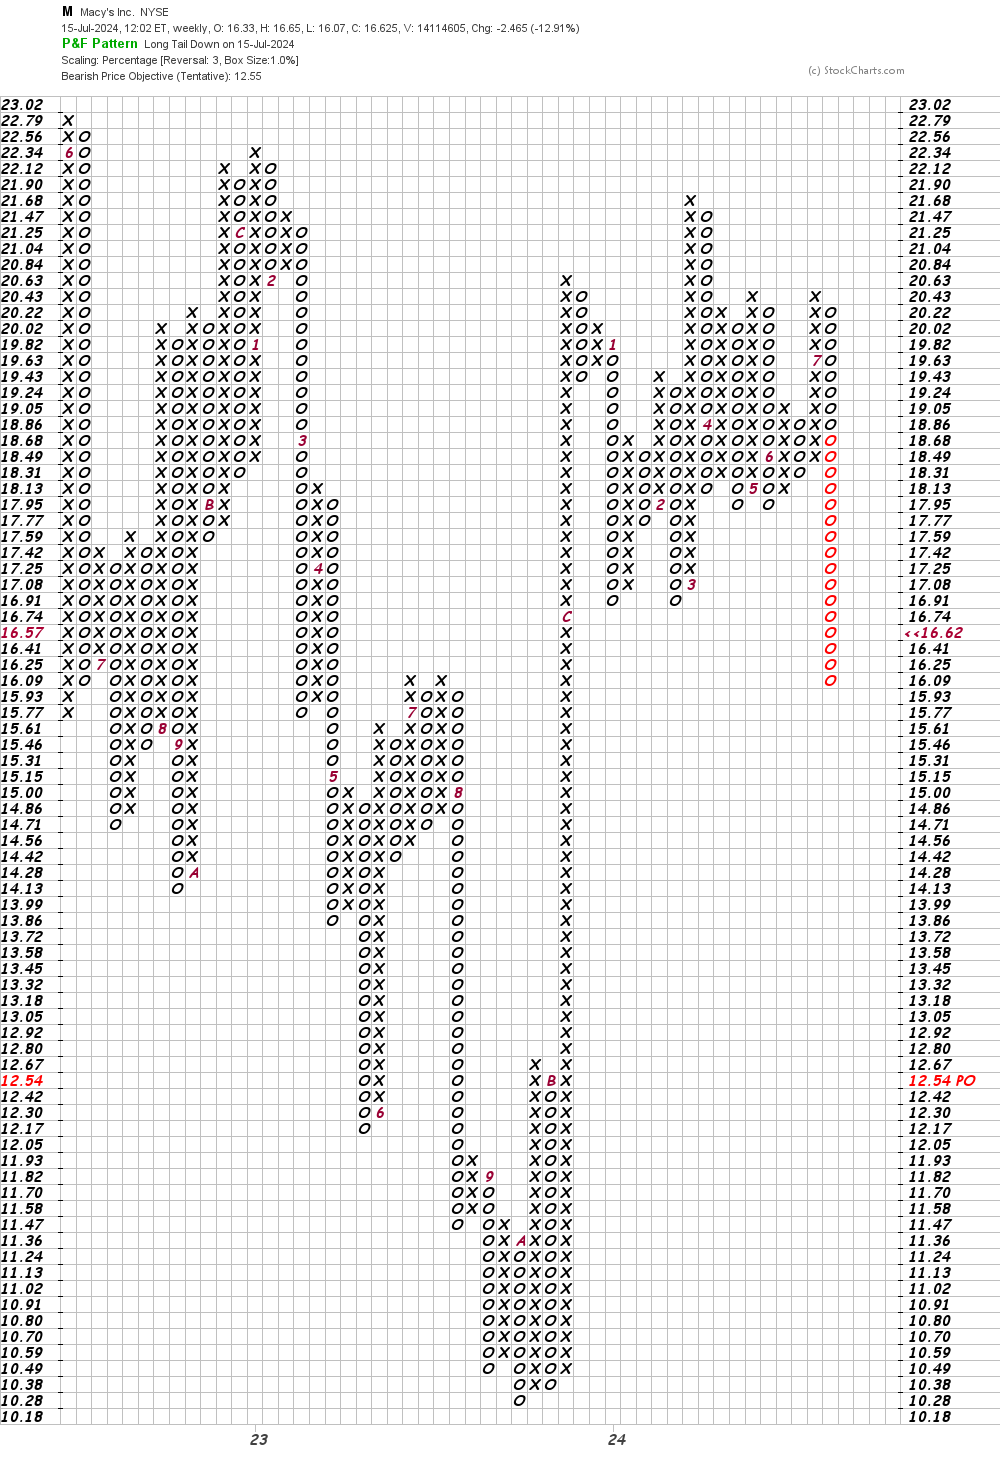
In this weekly Point and Figure chart of M below, the software is suggesting a target in the $13 to $12 area.
Bottom line strategy: I have no special knowledge of what Macy's management will do from here. Return to their turnaround strategy? Or shop themselves to someone else? Meanwhile, the charts suggest that prices could weaken further.
Employees of TheStreet are prohibited from trading individual securities.