Liberty Energy Looks Vulnerable to a Deeper Correction
The energy services firm has a mixed-to-bearish outlook and further decline wouldn't be a surprise.
You've reached your free article limit
You've read 0 of 1 free Pro articles.
Liberty Energy LBRT is an energy services firm that offers a number of services and technologies to onshore oil and natural gas exploration and production companies.
Let's check out the charts and indicators.
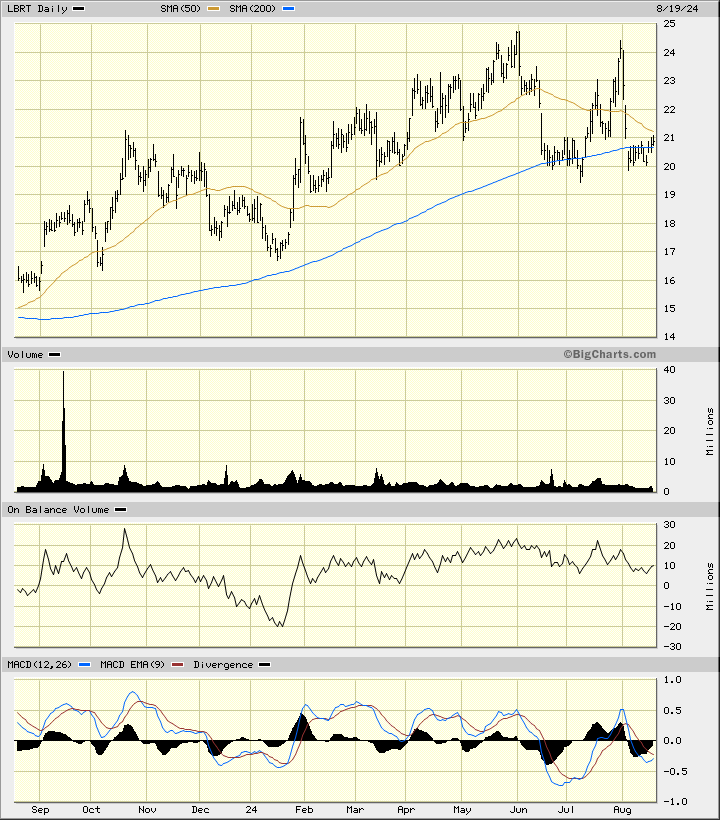
In this daily bar chart of LBRT below, I can see that prices have failed twice in the $24 to $25 area in May and early August. Prices have been trading around the 200-day moving average line in recent weeks and remain below the declining 50-day moving average line. The On-Balance-Volume (OBV) line has moved sideways to lower since late May. The Moving Average Convergence Divergence (MACD) oscillator is below the zero line.
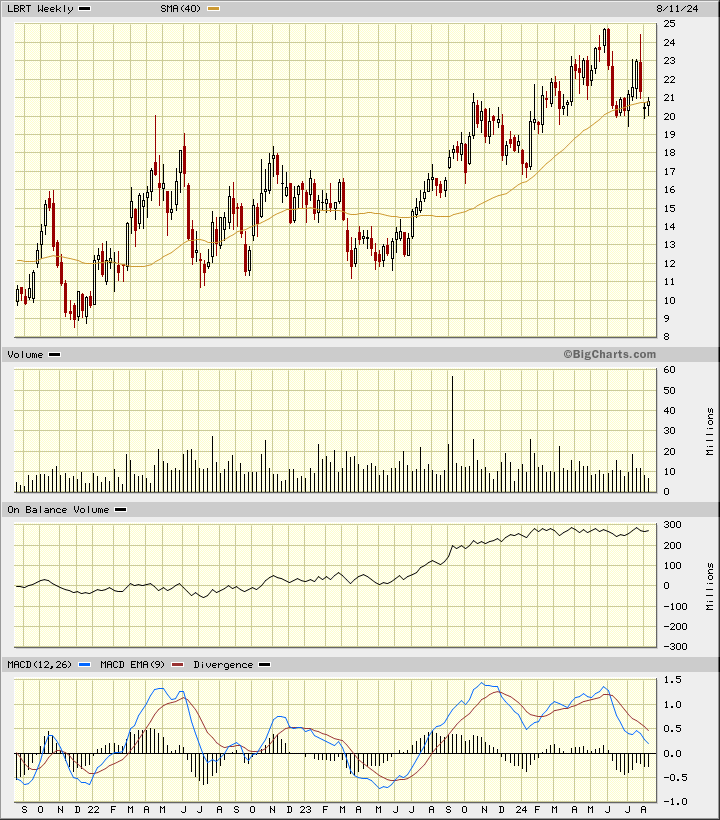
In this weekly Japanese candlestick chart of LBRT below, I can see a chart that looks vulnerable to a decline. Prices are trading below the 40-week moving average line. The weekly OBV line has been stalled the past seven months. The MACD oscillator is weak and an upper shadow on the last candle in July tells me that the path of least resistance is likely to be lower.
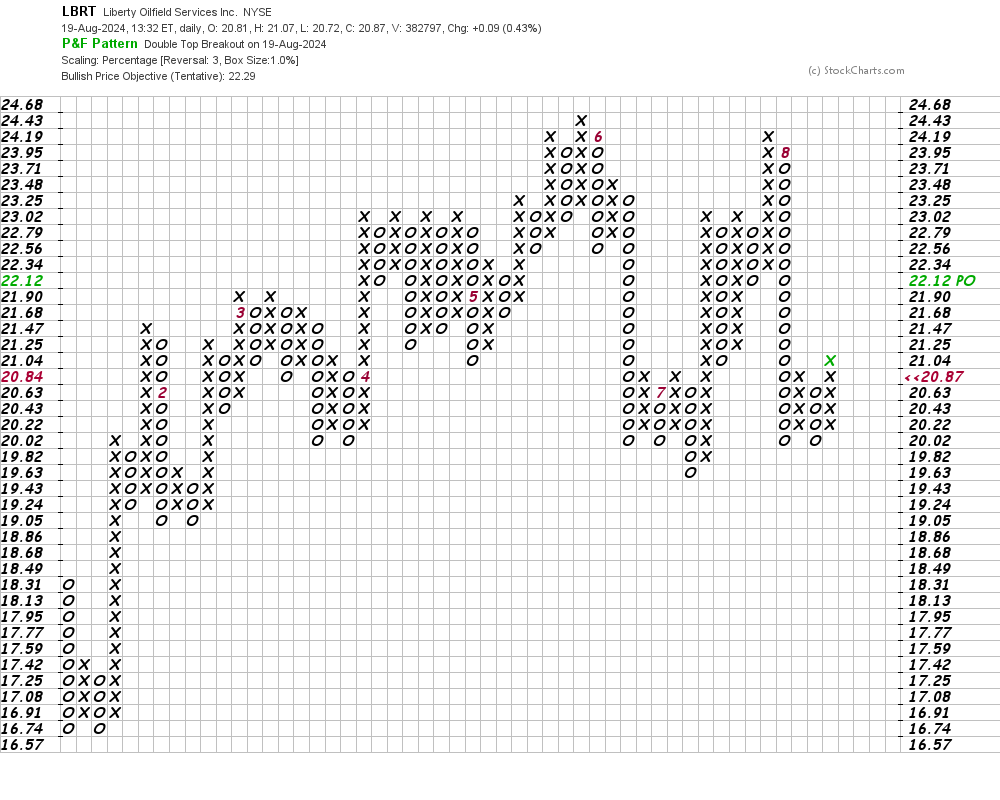
In this daily Point and Figure chart of LBRT below, I can see an upside price target in the $22 area.
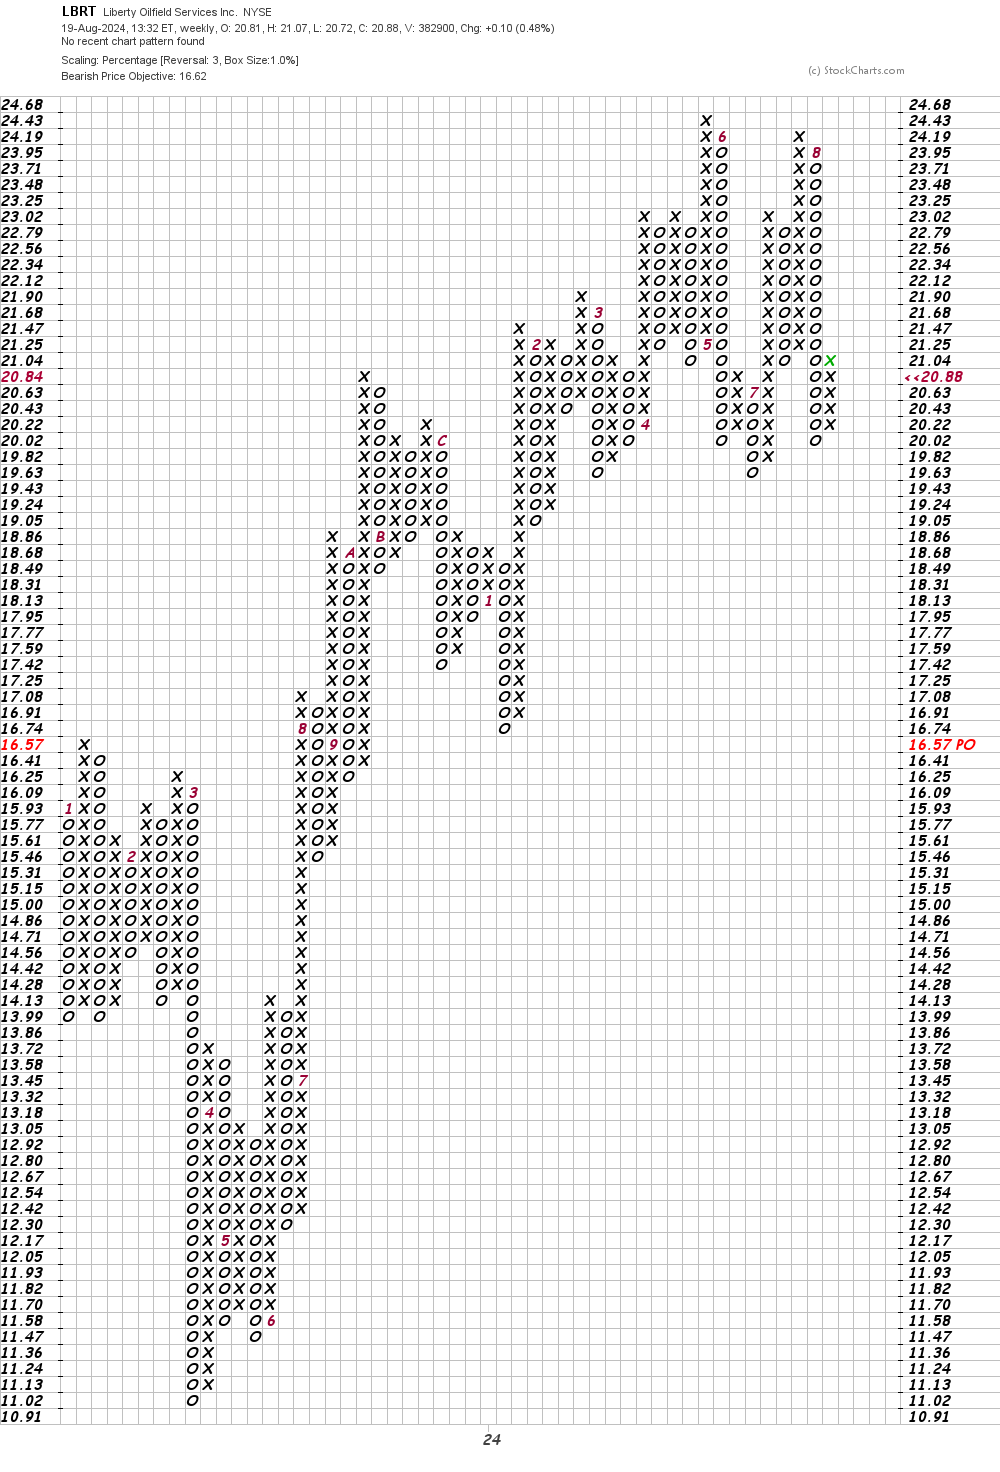
In this weekly Point and Figure chart of LBR below, I can see a downside price target in the $17 to $16 area.
Bottom line strategy: The charts of LBRT are mixed to bearish. I would take a cautious approach to any purchases of LBRT and won't be surprised to see a decline.
Employees of TheStreet are prohibited from trading individual securities.