After $260 Million Verdict, Traders Should Be Careful With a Healthcare Giant
A close look at the Johnson & Johnson price charts show lower lows could be next after a milestone court ruling.
You've reached your free article limit
You've read 0 of 1 free Pro articles.
An Oregon jury awarded a talc plaintiff $260 million in a verdict against Johnson & Johnson JNJ so let's review the charts and indicators to see if this is moving the needle.
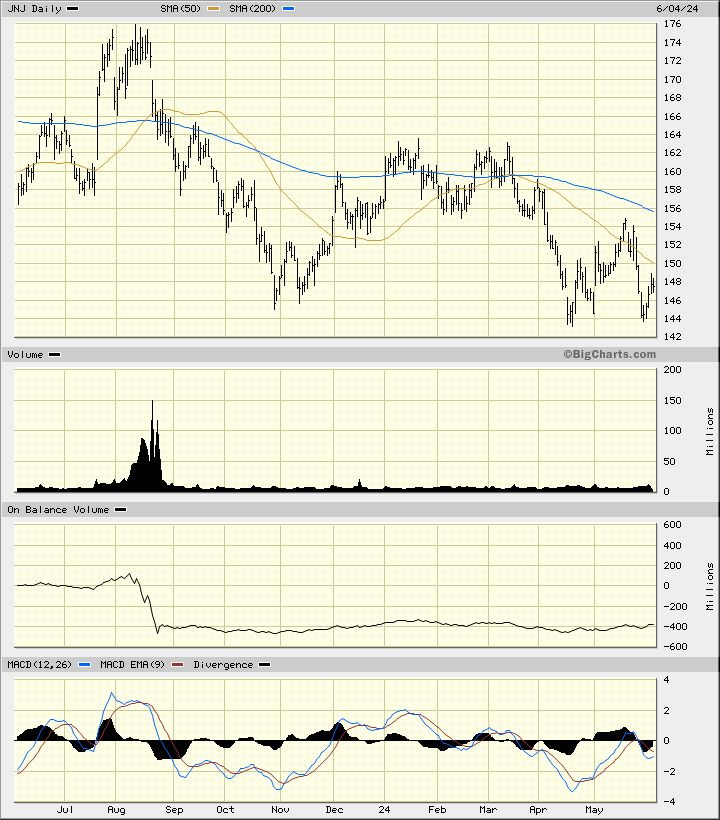
In this daily bar chart of JNJ below, I can see that prices have bounced off the $144 area twice — once in April and again in May. Prices trade below the declining 50-day moving average line and below the declining 200-day moving average line. The volume histogram is flat. The On-Balance-Volume (OBV) line shows us a slight upwards drift from April. The Moving Average Convergence Divergence (MACD) oscillator is slightly below the zero line and just shy of a potential buy signal.
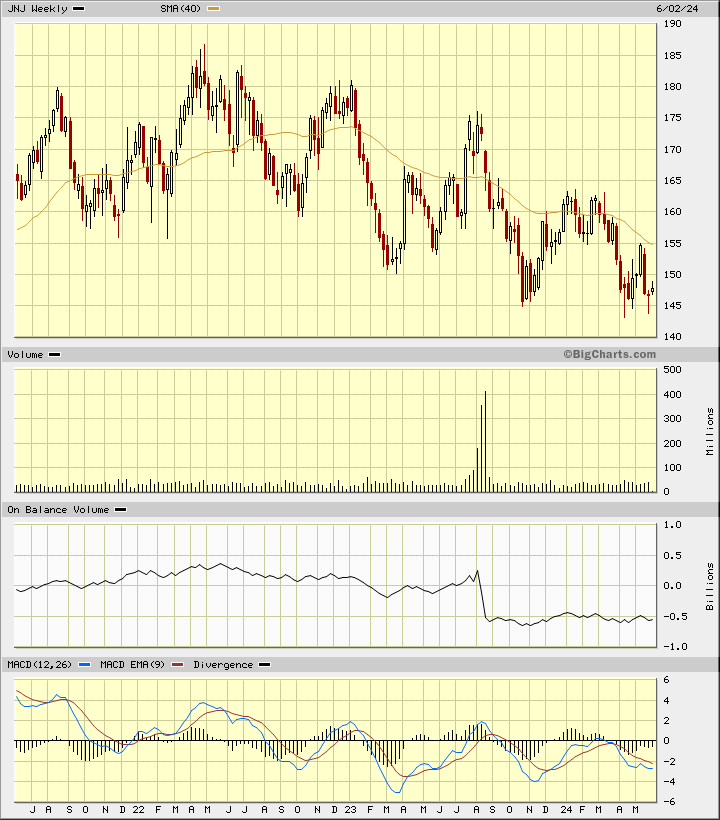
In this weekly Japanese candlestick chart of JNJ below, I see a mixed picture. Prices are trading lower in a long-term downward sloping channel but in recent weeks I can see a couple of lower shadows telling me that traders have been rejecting the lows in the $145 area and below. The weekly OBV line is neutral at best and the weekly volume pattern is flat. The MACD oscillator is bearish.
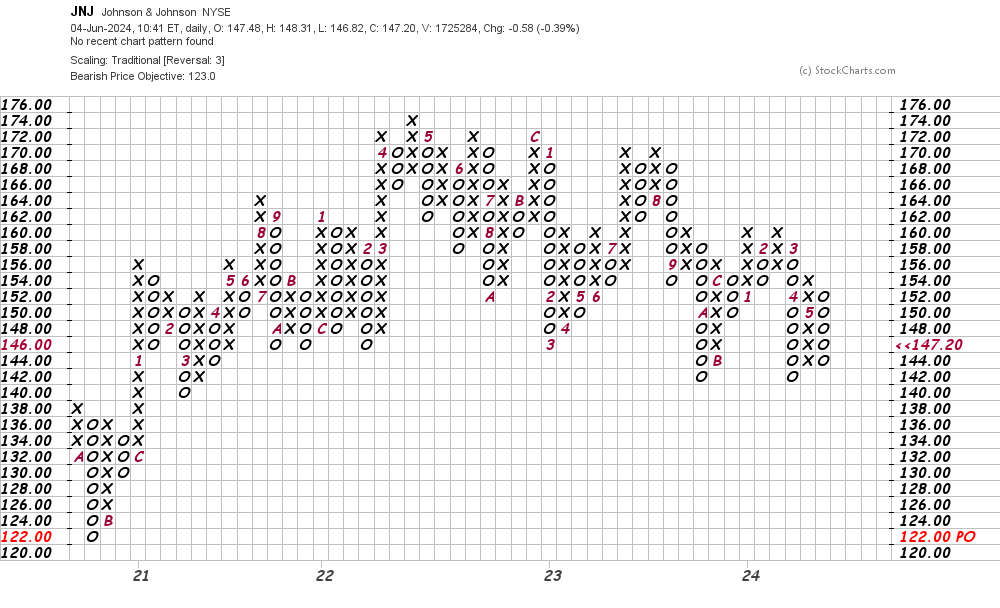
In this daily Point and Figure chart of JNJ below, I can see a potential downside price target in the $123 area.
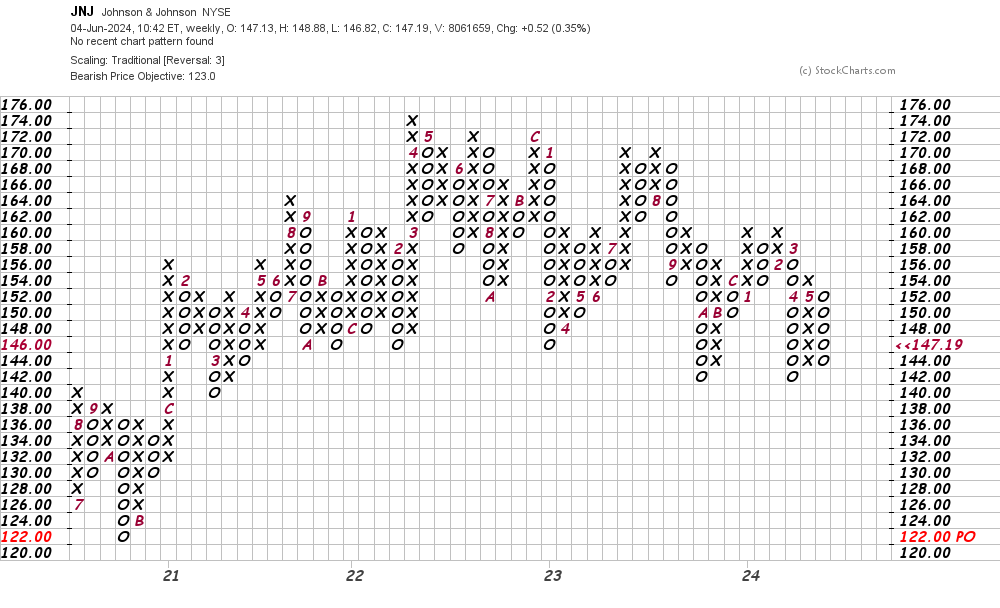
In this weekly Point and Figure chart of JNJ below, I can see a downside price target in the $123 area just like the daily chart above.
Bottom line strategy: The charts of JNJ are in a position to go either way — generate a bounce to the upside or decline to lower lows. A retest of the $142 area could mean that mean lower lows are in the cards. Trade carefully.
Employees of TheStreet are prohibited from trading individual securities.